All published articles of this journal are available on ScienceDirect.

Metabolic Factors in Diffuse Idiopathic Skeletal Hyperostosis – A Review of Clinical Data
Abstract
Objectives:
We aimed to review the literature linking metabolic factors to Diffuse Idiopathic Skeletal Hyperostosis (DISH), in order to assess associations between growth factors and DISH.
Method:
We identified studies in our personal database and PubMed using the following keywords in various combinations: “diffuse idiopathic skeletal hyperostosis”, “ankylosing hyperostosis”, “Forestier’s disease”, “diabetes”, “insulin”, “obesity”, “metabolic”, “growth factors”, “adipokines”, “glucose tolerance” and “chondrocytes”.
Results:
We were not able to do a systematic review due to variability in methodology of studies. We found positive associations between obesity (especially abdominal obesity), Type 2 diabetes mellitus, glucose intolerance, hyperinsulinemia and DISH.
Conclusion:
Current research indicates that certain metabolic factors associate with DISH. More precise studies deriving from these findings on these and other newly identified bone-growth factors are needed.
INTRODUCTION
Diffuse idiopathic skeletal hyperostosis (DISH) is a common skeletal disorder characterised by the presence of new bone formation. The new bone is particularly prominent in entheseal areas, where ligaments, tendons, joint capsule and annulus fibrosis fibres insert into bone. In addition, there is also an increase in the amount of normal cancellous and cortical bone, as well as generalised hyperostosis and a tendency to form post-operative heterotopic new bone [1].
DISH is a systemic condition and not just the result of local mechanical factors present in each of the involved areas of the skeleton. Since the early descriptions of DISH there have been associations with a variety of metabolic factors. Many of these have subsequently been further studied to better define any associations between a particular metabolic factor and DISH. In this report we review the available literature on a number of the putative metabolic factors that have been studied in patients with DISH. Our aim was to identify associations between such factors and DISH in order to better focus future research in this area.
METHODS
Papers discussed in this review were identified from the authors’ own databases and were supplemented with searches on PubMed and online journals. The following keywords were used in various combinations: “diffuseidiopathic skeletal hyperostosis”, “ankylosing hyperostosis”, “Forestier’s disease”, “diabetes”, “insulin”, “obesity”, “metabolic”, “growth factors”, “adipokines”, “glucose tolerance” and “chondrocytes”. The bibliography of relevant identified papers was scanned and information from abstracts and non-English sources was included as deemed relevant. The derived information is presented in summary form. Differences in patient identification and other methodology varied to the degree that formal systematic review was not valid.
The anatomical, radiological and clinical features of DISH have been described under various names for over 150 years. These studies also use different definitions for the diagnosis of DISH. These range from hyperostosis linking two vertebral bodies, without intervening disc disease and extend to different numbers of vertebrae linked by confluent anterior longitudinal ligament related new bone. The different criteria used are summarised in Table 1. In this review we have included studies using different criteria in order to maximize any associations with putative metabolic factors.
Criteria definitions for diffuse idiopathic skeletal hyperostosis.
| Criteria | Characteristics for “Definite” DISH | Comment |
|---|---|---|
| Contemporary* | Variations on spinal bony bridges. | No specific criteria stated. |
| Bywaters [2] | Complete bridge between 2 vertebral bodies with normal intervening disc. | Describes a minimal / inadequate criteria set. |
| Julkunen [3] | Lateral thoracic spine x-ray showing “two typical hyperostotic bridges”. | Radiological criteria for epidemiological purposes. |
| Harris [4] | Hypertrophic bony spurs with at least 2 bony bridges, normal sacro-iliac joints | Excluded changes associated with other identifiable spinal disease |
| Resnick and Niwayama [5] | Bridging of four contiguous vertebral bodies, minimal intervertebral disc disease, no facet joint ankylosis and no sacro-iliac joint inflammatory changes. | Most widely used criteria, does not include extra-spinal changes. |
| Arlet and MaziÉres [6] | Bridging of three contiguous vertebral bodies located in lower thoracic region, minimal intervertebral disc disease, no facet joint ankylosis no intra-articular erosion or ossification of sacro-iliac joints. | “Possible DISH” allowed with variations of criteria allowed. |
| Utsinger [7] | Bridging of four contiguous vertebral bodies primarily in thoracolumbar spine, minimal intervertebral disc disease, no facet joint ankylosis. | ‘Probable DISH” if bridging of two contiguous vertebral bodies plus bilateral patellar tufting, heel spurring and olecranon tufting. “Possible DISH” if two vertebrae joined in absence of extra-spinal enthesophytes or symmetrical extra-spinal enthesophytes in absence of spinal involvement. |
| Rogers and Waldron [8] | Ossification of anterior longitudinal ligament affecting 3 vertebrae (with/without) ankylosis, confined to right side of thoracic spine, evidence of symmetrical extra-spinal DISH, including patellar tufting, heel spurring, olecranon tufting, ossification of ligamentum flavum and spurring of tibial tuberosities. Lack of intervertebral changes not required for diagnosis. | Criteria used in paleopathological health assessments. |
| Maat et al. [9] | Spinal ligament ossifications of four or more contiguous vertebral levels and/or extensive peripheral enthesopathies | Criteria used in paleopathological health assessments. |
| CrubÉzy [10] | Bridging of two intervertebral spaces at the lower thoracic spine or bridging of three intervertebral spaces at any level. Decreased disc height in elderly subjects and para-articular bony bridging of the sacroiliac joints do not rule out the diagnosis | Probable DISH if flowing ossification along the anterolateral aspect of at least two contiguous vertebras and enthesopathies without remodeling of the cortex symmetrically involving the posterior calcanei, olecranons, and upper patellae. |
* Various authors.
Paleopathological studies associating DISH in adults with obesity.
| Author [Year] | No. Subjects | Year | Location | DISH Criteria* | Percent with DISH | Comment |
|---|---|---|---|---|---|---|
| Waldron [1985] [14] | 35 monks | 12-16th century | Merton Priory, Surrey, UK | Resnick | 8.6% | Monks were presumed to be well nourished |
| Rogers et al. [1985] [15] | 303 non-specified | Mediaeval | Various UK sites, including churches | “large flowing spinal osteophytes -typical of Forestier’s disease” | 2.3% | Probable mixed social status population - “control” group (includes 2 high SS clergy with DISH) |
| Bruintjes [1987] [16] | 1 high SS male | 10th century | Saint Servaas Basilica Maastricht The Netherlands |
Not known | 100% | |
| Mays [1991] [17] | Unclear number monastic skeletons 51 lay skeletons |
Mediaeval | Blackfriars Priory Ipswich, UK | 21 had “DISH”, 10 met Rogers and Waldron criteria none had DISH |
13.4% crude estimate | Skeletons examined from different grave sites showed high prevalence of DISH in high SS individuals |
| Costa and Weber [1995] [18] | 1 male of high SS | Renaissance | Basilica of San Lorenzo Florence Italy | Not stated – typical description | 100% | Another member of Medici family, obesity documented in writings and evident in portraits |
| Maat et al. [1995 and 1998] [9] [19] | 76 and 316 Friary skeletons | Mediaeval | Franciscan Priory Dordrecht The Netherlands |
Rogers and Waldron | 14.5% - 19% crude estimate | High prevalence of DISH in high SS individuals |
| Janssen and Maat [1999] [20] | 27 Canons | Mediaeval | Saint Servaas Basilica Maastricht The Netherlands |
Rogers and Waldron | 100% | High prevalence of DISH in high SS individuals |
| Vidal [2000] [21] | 99 non-specified | Mediaeval | Lorraine France | CrubÉzy | 2.8 - 3.7% | Likely mixed SS population, indicating a “control” population |
| Rogers and Waldron [2001] [8] | 192 low SS laymen 80 high SS males |
Mediaeval | Wells Cathedral and Royal Mint London, UK | Rogers and Waldron | Low SS = 3.1% High SS =13.7% P<0.001 |
High prevalence of DISH in high SS individuals – “comparative study” |
| Verlaan et al. [2007] [22] | 51 priests, monks, high status citizens | Mediaeval | Church of Our Lady Maastricht The Netherlands |
Rogers and Waldron | 40.4% 10 male, 5 female, 2 non-determinant |
High prevalence of DISH in high SS individuals |
| Giuffra et al. [2010] [23] | 2 males of high SS | Renaissance | Basilica of San Lorenzo Florence Italy | Rogers and Waldron | 100% | Members of Medici family, obesity documented in writings and evident in portraits |
* See Table 2 for DISH criteria, NA = not applicable, SS = social status.
Selected contemporary observations and studies associating DISH with obesity.
| Author [Year] | No. Subjects | DISH Criteria* | Obesity Criteria# | Percentage Obese | Comment |
|---|---|---|---|---|---|
| Forestier et al. [1950] [11] | 9 M | Not stated | Not stated | 66% | Important clinical observation No controls |
| Boulet et al. [1954] [29] | 8 M / 4 F | “Forestier” | Not stated | 17% | No controls |
| Schilling et al. [1965] [24] | 66 M / 14 F 80 controls |
“Forestier” | % above German norms | 66% >10% overweight, 25%>25% overweight; controls 34% and 9% | Obesity strongly associated with DISH |
| Schoen et al. [1969] [30] | 507 patients, > 30yrs with abnormal GT | NS – lateral Xray thoracic spine | NS | “Increased” | Compared to 347 patients, >50 yrs with normal GT |
| Beardwell [1969] [31] | 4 M / 4F | “Forestier” | Not stated | “Majority” | Familial study |
| Julkunen et al. [1971] [3] | 12,858 unselected persons | Julkunen | Weight-height ratio, triceps skinfold thickness | Significantly higher in both sexes [all age groups] with DISH compared to non-DISH subjects. | Obesity strongly associated with DISH |
| Harris et al. [1974] [4] | 17 M / 17 F | Harris | Not stated | 88% | No controls |
| Utsinger et al. [1976] [32] | 25 M / 5 F | Resnick | Not stated | 30% | No controls |
| Resnick [1978] [33] | 21 M | Resnick | Not stated | 22% | No controls |
| Boachie-Adjei et al. [1987] [34] | 21 of 75 autopsy spines | “Forestier” | Average weight | DISH =85kg, non-DISH =65kg | Obesity strongly associated with DISH |
| Troillet and Gerster [1993] [35] | 17 M / 8 F, matched for age, sex, BMI |
Resnick | BMI | Mean BMI = 29.5 | All obese |
| Daragon et al. [1995] [36] | 50 persons -DISH >60yrs 50 controls - matched sex, age, weight, height |
Resnick | Weight-height index | No difference between DISH and controls | Study controlled for weight |
| Mata et al. [1997] [37] | DISH -56, Spondylosis -43, Healthy controls -31 |
Resnick | Weight, BMI, WC | DISH significantly higher weight at marker state** and at study time, higher BMI, higher WC [p< 0.001] |
Obesity strongly associated with DISH |
| Coaccioli et al. [2000] [38] | Obese subjects- [1] 32 without T2DM, [2] 30 with T2DM Control - 30 subjects |
Utsinger | BMI>30 BMI <30 |
[1] 37.5% DISH [2] 40% DISH 2.5% DISH |
High prevalence DISH in obese subjects |
| Kiss et al. [2002] [25] | 69 M / 62 F with DISH; 69 M/62 F with spondylosis | Resnick | BMI | DISH BMI 27.8, controls 26.0, [p<0.001] | Obesity strongly associated with DISH |
| Miyazama and Akiyama [2006] [39] | DISH 35 M / 10 F Control [spondylosis] 70 M /20 F |
Resnick | Weight | DISH mean= 62.3 kg, Controls mean =58.33 kg [p<0.01] |
Obesity strongly associated with DISH |
| Mader et al. [2009] [27] | 13 M / 34 F DISH; 48 age-sex matched controls | Resnick | WC BMI > 30 |
WC significantly elevated in DISH, BMI > 30 in 39% DISH versus 26% controls | Obesity strongly associated with DISH |
| Zincarelli et al. [2012] [40] | DISH 105 M / 27 F Non-DISH 231 M / 73 F |
Resnick | BMI>30 | 35.6% DISH obese compared with 23% non-DISH [p< 0.009] |
Obesity strongly associated with DISH-all had cardiovascular disease |
| Haddad et al. [2013] [28] | 57 M / 21 F with DISH and PsA; 171 M / 62 F control patients with PsA only | Modified Utsinger [thoracic spine only, no extra spinal assessment included] | BMI Obesity definition not stated |
DISH BMI =32.9%, control BMI =28.7%, p<0.0001 DISH obesity=31%, control obesity=50%. [p<0.0001] |
Higher BMI strongly associated with DISH, large variance in obesity groups |
* M = males, F = females, # Weight-height ratio= weight in kilograms/height in centimetres-100, WC = waist circumference, BMI = Body Mass Index, GT = glucose tolerance, PsA =psoriatic arthritis, * “Forestier” indicates that diagnosis based on typical features of Forestier et al. description [11], ** marker state =weight at time of first marriage.
Selected studies of impaired glucose tolerance [IGT], including diabetes mellitus, in patients with DISH.
| Author | No. of Patients | Dish Criteria | Diabetic or IGT | Diabetic | IGT | Comment |
|---|---|---|---|---|---|---|
| Boulet et al. [1954] [29] | 8 M, 4 F | “Forestier” | 100% | 100% | NS | No controls, small sample |
| Recordier et al. [1959] [41] | 16 persons | “Forestier” | 56% | NS | NS | No controls, small sample |
| Einaudi et al. [1960] [42] | 15 M, 4 F | NS | 60% + | 60% | “many” | No controls, small sample |
| Cassan [1963] [43] | 43 persons | NS | 23% | NS | NS | 6.5% controls |
| Ott et al. [1963] [44] | 100 persons | NS | 50% | 25% | 25% | Suggests association of DISH with abnormal GT |
| Dahmen [1967] [45] | 120 persons | “Forestier” | 30% | 20% | 10% | 7.3% controls, suggests association with abnormal GT |
| Ott et al. [1967] [46] | 160 persons | NS | 55% | 22% | 33% | No controls but high prevalence abnormal GT |
| Perrotin [1968] [47] | 59 persons | NS | 61% + | 61% | NS | No controls but high prevalence abnormal GT |
| Lequesne et al. [1970] [48] | 43 persons with DISH, 46 without DISH | “Forestier” | DISH = 23% Control =6.5% [p<0.05] |
DISH = 23% Control =6.5% [p<0.05] |
NS | Significant association between DISH and diabetes |
| Julkunen et al. [1971] [3] | 94 M, 70 F with DISH / same number without DISH | Julkunen | DISH M 19.1% DISH F 28.6% Control M 7.4% Control F 12.8% [p < 0.05] |
NS | NS | Significant association between DISH and hyperglycaemia |
| Bregeon et al. [1973] [49] | 21 persons | “Forestier” | 43% | 30% | 13% | No controls |
| Henrard and Bennett [1973] [50] | 48 DISH 35 non-DISH Pima Indians |
“Forestier” | 50% DISH 28% non-DISH [p<0.05] |
NS | 50% had OGTT, 2hr glucose> 160mg% | Significant association between DISH and hyperglycaemia |
| Harris et al. [1974] [4] | 17 M, 17 F | Harris | 8.5% + | 8.5% + | Only 6 tested- all “normal” | No controls |
| Utsinger et al. [1976] [32] | 25 M, 5 F | Resnick | 17% | NS | Fasting hyperglycaemia | No controls |
| Rosenthal et al. [1977] [51] | 50 persons | Resnick | 32% | NS | NS | No controls |
| Tsukamoto et al. [1977] | 157 M, 18 F | Resnick | “no correlation between DISH and diabetes” in males | NS | NS | Hiroshima survivors |
| Resnick et al. [1978] [33] | 21 M | Resnick | 29% | NS | NS | No controls |
| Arlet et al. [1978] [52] | 100 M | “Forestier” | 14% | 9% | 5% | No controls |
| El Garf and Khater [1984] [53] | 38 persons | Resnick | 37% | NS | NS | No controls |
| Cassim et al. [1990] [54] | 21 persons DISH 479 no DISH |
Resnick | 52.4% | 33.3% history DM in DISH, 7.7% in controls [p<0.0001] |
19.1% IGT to glucose load | High diabetes in DISH group, but small number of patients |
| Troillet and Gerster [1993] [35] | 17 M, 8 F DISH 17 M, 8 F no DISH, matched for age, BMI. |
Resnick | No difference | No difference | Fasting hyperglycaemia | IGT not different, but small numbers |
| Daragon et al. [1995] [36] | 50 persons -DISH >60yrs 50 controls - matched sex, age, weight, height |
Resnick | No difference | No difference | No difference in glucose tolerance | No association DISH and Dbs / hyperglycaemia. |
| Vezyroglou et al. [1996] [55] | 100 DISH 100 controls, matched age, sex, BMI, excess body weight |
Resnick | No difference | 22% in DISH, 3% in Controls [p<0.0001] |
Increased dyslipidemia /hyperuricemia and DM in DISH [p<0.0001] |
|
| Kiss et al. [2002] [25] | 69 M / 62 F -DISH; 69 M/62 F men /women - spondylosis | Resnick | DISH =19.8% Control = 9.1% [p<0.05] |
DISH =19.8% Control = 9.1% [p<0.05] |
NS | Significant association between DISH and diabetes |
| Mader et al. [2009] [27] | 13 M / 34 F DISH; 48 age-sex matched controls | Resnick | NS | DISH =49% Control = 33% NS |
DISH =40% Control = 10% Fasting glucose >110 mg/dL [p<0.05] |
Significant association between DISH and hyperglycaemia |
| Eckertova et al. [2009] [56] | 20 M, 9 F-DISH, 8 M, 9 F- non-DISH, matched for age, BMI. | Resnick | DISH = 41.4% Control =7.8% [p<0.05] |
NS | DISH = 41.4% Control =7.8% [p<0.05] |
Significant association between DISH and hyperglycaemia |
| Zincarelli et al. [2012] [40] | DISH 105 M / 27 F Non-DISH 231 M /73 F |
Resnick | No difference in rates of T2DM or fasting blood glucose >100mg/dl | All patients had severe cardiac disease –no healthy controls |
M = males, F = females, GT =glucose tolerance, IGT = Impaired glucose tolerance, T1DM = Type 1 diabetes mellitus, T2DM = Type 2 diabetes mellitus, NS = not stated, Dbs =diabetes, “Forestier” indicates that diagnosis based on typical features of Forestier et al. description [11].
Selected estimates of the prevalence of DISH in patients with abnormal glucose tolerance, including type 2 diabetes mellitus.
| Author | No. of Patients | Criteria for Abnormal GT | Dish | Dish Criteria | Comment |
|---|---|---|---|---|---|
| Boulet et al. [1954] [29] | 265 persons | All diabetics | 7% | “Forestier” | No controls |
| Ott et al. [1963] [44] | 82 persons, “mainly men” | NS | 50% | “Forestier” | “Usually old, benign diabetes” |
| Hajkova et al. [1965] [57] | 83 F, 18 M | NS | 41% F 33% M |
NS | No controls; age of patient & duration of diabetes increase likelihood of DISH |
| Julkunen et al. [1966] [58] | 510 persons | Abnormal fasting BSL | 13% | Julkunen | Overall prevalence |
| Julkunen et al. [1966] [58] | 122 persons age 60-69 | Abnormal fasting BSL | 21% | Julkunen | Control group 4% DISH in 148 non diabetics |
| Julkunen et al. [1968] [59] | 83 Db M 1175 non-Db M |
Existing Db or 2 hour GTT abnormal | 4.8% 1.6% |
Julkunen | Not significantly different, younger policemen |
| Schoen et al. [1969] [30] | 507 persons age > 30 yrs |
“Overt or latent diabetes” | 25% | NS-lateral Xray thoracic spine | Control group of 347 non-diabetics, age > 50 yrs - 2.6% DISH |
| Ott et al. [1967] [46] | 105 persons | NS | 44% | NS- lateral CXR | No controls |
| Lequesne (1970) | 52 | NS | 29% | “Forestier” | 13% in 46 “controls” |
| Coaccioli et al. [2000] [38] | 170 “consecutive subjects” – 130 patients and 40 normal subjects | 30 T1DM 30 obese T2DM 20 non-obese T2DM 18 IGT 32 obese [BMI> 30] 40 normal subjects |
26.6% 40.0% 30.0% 22.2% 37.5% 2.5% |
Utsinger | Obese persons and obese diabetics had highest percentage of DISH. Statistics not presented, but DISH said to be statistically increased in these groups. |
| Sencan et al. [2005] [60] | 133 T2 DM outpatients 133 age, sex, weight –matched, outpatient controls |
All Type 2 diabetics | 12.0% in T2DM, 6.8% in Controls [NS - p>0.05] |
Resnick | Mean weight 67.7 and 65.4 kgs, respectively |
M = males, F = females, NS = not stated, BSL = blood sugar level, DB = diabetic, GTT = glucose tolerance test, CXR = chest X-Ray, “Forestier” indicates that diagnosis based on typical features of Forestier et al. description [11], T2DM = Type 2 diabetes mellitus, kgs = kilograms.
Selected studies of growth hormone and related peptides in DISH.
| Author | Patients | Dish Criteria | Methods | Result | Comment |
|---|---|---|---|---|---|
| Bregeon et al. [1973] [49] | 10 M | “Forestier” | Basal and post-glucose GH | GH-Normal levels | Small sample |
| Harris et al. [1974] [4] | 5 younger persons | Harris | NS | GH-Normal levels | Small sample |
| Resnick et al. [1978] [33] | 6 persons | Resnick | NS | GH -normal levels | Small sample. |
| Littlejohn and Smythe [1981] [61, 63] | 11 M DISH 8 M, age/ weight -matched no DISH |
Resnick | Fasting basal and post-glucose GH, IGF-1 | GH- no difference IGF-1 –no difference |
Small sample, controlled for BMI. |
| Altomonte et al. [1992] [64] | 6 M, non-obese DISH, 10 M, weight-matched no DISH |
Resnick | Fasting basal and post insulin tolerance test [ITT] GH | Basal GH not elevated, significant GH elevation post-ITT compared to control [p<0.05] | Only study to show post stimulation elevation of GH |
| Denko et al. [1994] [62] | 14 white M DISH, 22 M no DISH 8 white F / 8 black F DISH, 22 white F/ 10 black F no DISH |
Resnick | Fasting morning GH, IGF-1 | GH- elevated IGF-1-no difference in males/ black females, elevated in white females |
Study confounded by significant differences in weight, with DISH groups being heavier. |
| Denko et al. [1996] [65] | 8 M DISH 12 M OA 22 M no DISH |
Resnick | Fasting morning GH, IGF-1 | Serum IGF-1 - same as controls, synovial IGF-1 same as OA. Serum GH- higher [and same] in DISH and OA than controls, synovial GH same as OA group. |
All DISH patients had knee effusions, no matching for weight |
| Denko et al. [2002] [66] | 15 M DISH 15 M controls |
NS | Fasting morning GH, IGF-1 | GH but not IGF-1 lower in asymptomatic DISH patients, but NS | Poorly controlled study |
| Denko et al. [2003] [67] | 19 M DISH 34 M no DISH, not controlled for weight |
Resnick | Fasting morning intra-erythrocyte GH | Intra-erythrocyte GH same in DISH and controls | |
| Sencan et al. [2005] [60] | 133 T2 DM outpatients 133 age, sex, weight –matched, outpatient controls |
Resnick | Fasting IGF-1 | No difference | |
| Denko and Malemud [2006] [68] | 11 DISH with BMI 23-28 10 DISH with BMI >28 |
Resnick | Fasting morning serum GH, IGF-1 | GH and IGF-1 no different between BMI groups | “Additional” data from 25 DISH patients showed no correlation between BMI and GH or IGF-1. |
| Eckertova et al. [2009] [56] | 20M, 9F -DISH 8M, 5F- no DISH, matched for age, |
Resnick | Fasting and post-OGTT serum GH, IGF-1, IGF-BP3 | No difference between groups |
M = males, F = females, NS = not stated, BMI = body mass index, GH = Growth Hormone, IGF-1 = Insulin-like growth factor -1, OA = osteoarthritis, OGTT =oral glucose tolerance test, IGF-BP3 = insulin-like binding protein 3, ITT = insulin tolerance test.
Selected studies of Insulin and related hormones in DISH.
| Author | Patients | Criteria | Methods | Result | Comment |
|---|---|---|---|---|---|
| Littlejohn and Smythe [1981] [61] | 11 males DISH 8 age, weight-matched non-DISH males |
Resnick | Fasting and post-glucose insulin | Insulin significantly elevated in basal and stimulated state. | Small sample, controlled for BMI. |
| Altomonte et al. [1992] [64] | 6 M, non-obese DISH, 10 M, weight-matched no DISH |
“Resnick” | Fasting and post-glucose insulin, C-peptide | No significant difference to controls | |
| Troillet and Gerster [1993] [35] | 17M, 8F DISH 17M, 8F matched for age, sex, BMI. |
Resnick | Fasting glucose, insulin | No significant difference to controls | |
| Denko et al. [1994] [62] | 14 white males 22 controls 8 black females 10 controls |
Resnick | Fasting morning serum | Insulin – significantly elevated | Study confounded by significant differences in weight, with DISH groups being heavier. |
| Denko and Malemud [2006] [68] | 11 DISH with BMI 23-28 10 DISH with BMI >28 |
Resnick | Fasting morning insulin | Insulin elevated significantly in DISH with BMI> 28 | “Additional” data from 25 DISH patients showed strong correlation between BMI and insulin levels. |
| Sencan et al. [2005] [60] | 133 T2 DM outpatients 133 age, sex, weight –matched, outpatient controls |
Resnick | Fasting insulin | No difference | Positive correlation between age and insulin levels in DISH patients without T2DM |
| Mader et al. [2009] | 13/34 male/females DISH; 48 age-sex matched controls | Resnick | Fasting insulin | No difference | BMI in both groups >30 |
| Eckertova et al. [2009] [56] | 20M, 9F DISH 8 M, 5F no DISH |
Resnick | Fasting and post-OGTT, serum insulin, C-peptide | No difference | Decreased insulinogenic index and insulin/C-peptide ratio in DISH |
M = males, F = females, NS = not stated, BMI = body mass index, OGTT =oral glucose tolerance test.
Selected studies of adipokines in DISH-related disorders.
| Author | Patients | Criteria | Methods | Result | Comment |
|---|---|---|---|---|---|
| Shirakura et al. [2000] [74] | 32M/17F patients with OSL; 37M/32F age and BMI-matched controls | Patients with OSL identified -no criteria | Serum leptin and insulin | Leptin and insulin significantly elevated in female but not male OSL patients | The elevated leptin in females with OSL may link to insulin. The significance of this observation is unclear. No positive findings in males. |
| Ikeda et al. [2011] [75] | 68M/57F patients with OSL; 35M/27F age and BMI-matched controls | Patients with OSL identified -no criteria | Serum leptin, insulin | Leptin and insulin significantly elevated in females corrected for BMI, but not male OSL patients | Elevated leptin and insulin correlated with extent of spinal ossification in females. Inconclusive associations with bone turnover. No positive findings in males. |
OSL = ossification of spinal ligaments, BMI = body mass index.
Obesity and DISH
In the defining paper of Forestier and Rotes-Querol it was noted that six of the nine males described with DISH, then termed ankylosing hyperostosis, were stated to be obese [11]. Other subsequent studies have also noted this association.
A series of paleopathological studies is summarized in Table 2. These studies show that there is a significant difference in the prevalence of DISH between groups with different social status, with specific material from monastic and high-status burial sites being more affected by DISH than remains from laymen burials [12]. The proposition is that the higher social status groups were excessively nourished, with probable increased rates of obesity, compared to the poorer laymen [8]. It is noted that these studies vary in their criteria for defining DISH and that different definitions result in different rates of diagnosis in the same populations [12]. Nevertheless, it is the differences between rates of DISH in the higher and lower social status classes that imply an association between DISH and nutritional factors, particularly those relating to obesity.
In one study the prevalence of DISH in skeletons from cemeteries in churches and chapels, serving priests, monks and lay benefactors, was compared to lay cemeteries in adjacent regions serving the general population [8]. By combining data from the Wells Cathedral and the Royal Mint sites, the authors found that skeletons deemed to derive from high social status individuals had a significantly higher prevalence of DISH compared to those deemed to be of lower social status (P<0.001). The diet of high social status individuals, such as those living in mediaeval monasteries, was high in animal fat and alcohol [8]. A diet rich in animal fat and alcohol and low in vegetables and fruit has been detailed in members of the Medici family found to have DISH [13].
These findings are consistent across many regions and in different countries even when variations of criteria for diagnosis of DISH are used.
More contemporary clinical data on associations between DISH and obesity are presented in Table 3.
Many of these studies are observational and of historical interest, with no appropriate comparator group. Schilling et al. found higher levels of obesity in patients with DISH compared to controls [24]. Additionally, Julkunen et al. found a significant association between DISH and obesity in a large population survey in Finland [3]. DISH patients had a higher weight - height index compared to controls without DISH, particularly in those over the age of sixty.
An age and sex-matched comparative study of patients with DISH and those with spondylosis showed a significantly higher body mass index [BMI] in the DISH group and as well a higher weight at the age of 25 years in the DISH group (all p<0.001) [25].
Mader et al. found significantly higher waist circumference, a marker of obesity and metabolic syndrome [26], in both men and women with DISH [27]. The BMI was statistically higher in both the men and women with DISH compared to the controls and the percentage of DISH patients with BMI above 30, indicating obesity, was also significantly higher.
In a review of patients with psoriatic arthritis [PsA] from the one cohort [28], 78 patients were identified with DISH using the spinal criteria of Utsinger [7]. These patients were compared to 234 PsA patients without DISH from the same
cohort. There was a significant increase in BMI in the PsA patients with DISH compared to those with PsA without DISH. Obesity rates were higher in the PsA patients without DISH [mean ± standard deviation = 50 ± 33.8 versus the PsA plus DISH group [31 ± 70.5]. The very high variance in the data makes interpretation of the association of DISH and obesity in this population unclear, although the BMI was significantly elevated.
Diabetes and DISH
Overlapping and subsequent studies have focussed on the association between DISH and altered glucose tolerance and adult onset Type 2 diabetes mellitus. These studies have looked at various aspects of glucose intolerance defined in different ways. The studies used contemporaneous criteria for the diagnosis of diabetes and/or criteria based on different thresholds for glucose intolerance, following different glucose challenges.
The studies seeking association between DISH and glucose intolerance and/or diabetes have addressed the issue in two ways. Firstly, studies have looked for abnormalities of glucose intolerance in patients defined as having DISH. These are summarized in Table 4.
In a Finnish study Julkunen [3] found a significant difference between the rates of hyperglycaemia in patients with and without DISH [p<0.05]. Hyperglycaemia, was defined as >250mg/100ml one hour after an oral glucose tolerance test or the presence of established diabetes. Analyses of intercorrelations between glucose tolerance and obesity in this series suggested that decreased glucose tolerance and obesity contributed at least in part to DISH, independently of each other.
Mader found higher fasting glucose levels in DISH patients compared to controls but many in each group were diabetic and medication was not taken into account. Overall these studies are very suggestive of an increased rate of Type 2 diabetes and/or impaired glucose tolerance in patients with diagnosed DISH, although there is marked inconsistency in diagnosis of DISH, selection of controls and definitions used to define diabetes and impaired glucose tolerance.
Another series of studies have sought to assess the rates of DISH in patients with abnormal glucose tolerance or diabetes. These studies also vary significantly with respect to diagnostic criteria and study design and are summarized in Table 5.
Although the quality of these studies varies, there is a general theme indicating that there is an excess prevalence of DISH in patients with diabetes or abnormal glucose tolerance compared to those with normal glucose tolerance. There is an increased prevalence of DISH in diabetic patients recruited from hospital clinics, likely reflecting bias due to comorbidity factors [57]. However, when non-diabetics, aged 60 - 69 years, were compared to diabetics of the same age the prevalence of DISH increased from 4% to 21% [p<0.001] [58].
Additionally, glucose intolerance and obesity seem to act as independent risk factors in their association with DISH [3]. There has been no relationship found between the degree of hyperglycaemia and the severity of the bony change in DISH [48]. Importantly no patient with juvenile onset, i.e., Type 1 [primary insulin deficient] diabetes has been recorded as having DISH.
Growth Hormone and Related Hormones and DISH
It has been proposed that growth hormone or related hormones may be involved in the new bone growth, and also the increased rates of diabetes, that characterize DISH. Table 6 summarizes selected studies of growth hormone and related peptides in patients with DISH. Growth hormone measured in one study, both after an overnight fast and after a glucose challenge, showed no difference between DISH patients and weight-matched controls [61]. In contrast, in a study that involved DISH subjects that were significantly heavier than the controls the basal growth hormone was also significantly higher [62]. IGF-1 levels were not different to controls. In this study basal insulin was also significantly elevated. Overall, however there is no conclusive data to indicate elevation of growth hormone or Insulin-like growth factor in patients with DISH.
Insulin and Related Hormones and DISH
Insulin is elevated in Type 2 diabetes mellitus and is a bone growth promoting peptide [69]. Various studies seeking associations of these hormones with DISH are summarized in Table 7.
Insulin, measured both after an overnight fast and after a glucose challenge, showed significant elevation in DISH patients compared to weight and BMI–matched controls [p<0.001] [61]. The change in insulin was noted despite no significant change in blood glucose levels, either at base-line or after glucose stimulation. Insulin levels, measured 2 hours after glucose challenge showed highly significant correlation to BMI in the DISH group. Some studies support this finding [68], while others (as outlined in Table 7) do not.
The fact that insulin levels correlate with being overweight [55, 60, 68, 70] is a potential confounder in these studies.
Adipokines
The increased rates of obesity, particularly abdominal fat, in patients with DISH might imply a role for various adipokines in the pathogenesis of this disorder. Many of these fat-derived cytokine-like hormones have significant effects on bone metabolism [71].
Leptin is encoded in the obese gene, secreted by adipose tissues and involved in maintenance of weight. Leptin has effects on bone in mice promoting osteoblast numbers and activity through peripheral pathways [72]. In humans leptin levels associate with increase cortical but not cancellous bone [73]. Hereditary obese rats [Zucker fatty (fa/fa) rats] have an aberration of the leptin receptor gene and develop ossification of spinal ligaments [OSL], a condition with similarities to DISH that targets the posterior longitudinal spinal ligament [74]. Japanese female patients with OSL, but not males have elevated leptin, which correlates with elevated insulin levels [74]. There is a positive correlation with extent and severity of ligamentous ossification in OSL [75]. The leptin receptor is expressed in human spinal ligaments, although in vitro studies did not show increased collagen synthesis after exposure to leptin [74]. Both leptin and its receptor are also expressed in the annulus, increasing with advanced age [76]. Leptin is found in high levels in osteophytes of patients with osteoarthritis [77]. Leptin has not been specifically studied in DISH but the studies in the related ossifying disorder of OSL are shown in Table 8. Leptin levels were significantly elevated in females with OSL in this study.
In 37 patients with DISH the serum levels of the osteoblast inhibitor Dickkopf-related protein-1 DKK-1 were significantly lower compared to 22 healthy, age–matched controls. Lower levels associated with more spinal hyperostosis independent of age, sex, bone-turnover markers or bone mineral density [78]. However, another study did not find an association between DKK-1 and DISH [79] making this observation difficult to interpret.
BONE REGULATORY PROTEINS
Co-Morbid Metabolic Factors
Patients with DISH have significant associations with gout, hyperuricemia and dyslipidaemia, likely through the shared association with obesity [27, 55, 80-84]. There is no evidence that these factors in their own right cause the new bone formation characteristic of DISH
Vitamin A
Vitamin A –related products can cause hyperostosis in animals and man [85, 86]. Vitamin A has been shown to be elevated in patients with DISH [87] but it remains unclear as to the exact role of Vitamin A in DISH.
Animal Models
DISH has been described in numerous animal species but there are no well-designed animal experiments to demonstrate the causal relationship between metabolic factors and DISH [88, 89].
Metabolic Factors and Targets in DISH
The metabolic factors present in patients with DISH, such as insulin, likely interact with key candidate cellular targets linking to new bone formation. These include chondrocytes and periosteal mesenchymal cells within the enthesis [90, 91] (See Fig. 1). These cells have been shown to proliferate under the influence of transforming growth factor- β1, insulin and bone morphogenic protein (BMP2) to form fibroblasts, myoblasts and osteoblasts [91]. Metabolic factors, such as insulin, growth hormone and insulin-like growth factor 1, all have the ability to promote bone formation through stimulation of proliferation of osteoblasts, chondrocytes and fibroblasts [82, 84]. The exact mechanisms that contribute to the new bone growth, particularly in entheseal regions, in patients with DISH are unknown. However, relevant important signalling pathways are likely to include the Wnt -β-catenin pathway, nuclear factor κB, BMP2, prostaglandin I2 and endothelin1 [92].
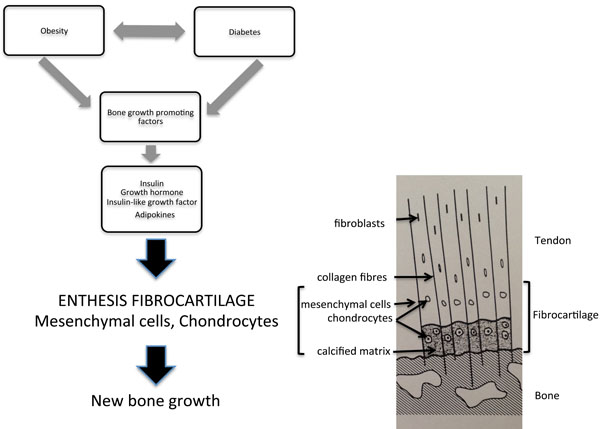
Growth factors present in patients with DISH, such as growth hormone, insulin or insulin-like growth factor, target the chondrocytes and mesenchymal cells in the uncalcified portion of the enthesis. Proliferation of these cell types results in new bone formation. The components of the enthesis are detailed in the diagram to the right. Molecular mechanisms within the entheseal cells have been recently summarized [92].
FUTURE STUDIES
There is a need for further studies to better define the important background metabolic factors that promote the new bone formation that characterizes DISH. These need to include a group of interacting factors, including genetic, epigenetic, metabolic and bone-related signalling pathways. Study of younger patients with early DISH may better identify important metabolic factors but this approach is limited by current diagnostic criteria that identify well-established DISH, with high rates of confounding co-morbidities [93]. It is important for future studies to incorporate direct examination of the cellular elements of the key target organ of DISH, the enthesis.
SUMMARY
This review examines the available literature on metabolic factors in patients with DISH. The identified literature was not considered robust enough to perform a structured systematic review due to inconsistencies with study methodologies. These include different criteria for diagnosis of DISH, and different definitions for diabetes, and impaired glucose tolerance. Metabolic studies varied in the protocols used, with different time frames and stimulation protocols. Controls were often lacking or poorly matched for metabolic factors. We have commented on these issues in the summary tables.
Nevertheless we aimed to make this review a contemporary summary on the topic to act as a reference standard for future studies.
Despite the above comments this review of metabolic factors in DISH does allow for certain conclusions. There is a general theme that metabolic factors are of great importance in DISH. Obesity, particularly abdominal obesity, is strongly linked to DISH. Further exploration of the role adipokines in patients with DISH is required. Type 2 diabetes is increased in DISH, independent of obesity. The link between obesity, type 2 diabetes and insulin elevation is strong. Of all the potential growth factors examined in patients with DISH, insulin is likely to have a key role in the pathophysiology of DISH.
Finally, it is clear that more studies are required on this important aspect of DISH, a condition that is increasing in frequency and significance.
CONFLICT OF INTEREST
The authors confirm that this article content has no conflict of interest.
ACKNOWLEDGEMENTS
Declared none.