All published articles of this journal are available on ScienceDirect.

Does Disease Activity Influence the Levels of Uric Acid in Psoriatic Arthritis?
Authors Info & Affiliations
Abstract
Background:
Hyperuricemia is not only associated with the development of gout but also with renal and vascular dysfunction. The prevalence of this condition has already been studied in psoriasis, but there are a few studies that have been carried out in psoriatic arthritis (PsA). Some studies have shown an association with metabolic syndrome, while others with the extent of cutaneous involvement, but there are no studies that have evaluated the disease activity with compound indexes.
Objective:
The aim of the study was to determine if disease activity, measured by different composite scores, influences the levels of uric acid.
Method:
This was a cross-sectional, observational study, which included 52 PsA patients. Clinical assessments included dactylitis, tender and swollen joint counts, Psoriasis Area and Severity Index, Leeds Enthesis Index, Minimal Disease Activity and Disease Activity for Psoriatic Arthritis. Hyperuricemia was defined as serum uric acid levels ≥ 6mg/dL in females and ≥ 7mg/dL in males.
Results:
Among the 52 included patients, 55.76% were female. The mean age was 54.9 ± 11.6 years. Hyperuricemia occurred in 26.92%. Demographic data, diet, comorbidities and medication were similar between patients with and without hyperuricemia. Patients with hyperuricemia had higher waist circumference (p <0.0046). There was no difference in disease activity between groups, either in the isolated items or in the composite indexes. There was a significant difference in uric acid levels according to the classification of chronic kidney disease by estimated glomerular filtration rate (p=0.0016). Individuals using leflunomide had significantly lower levels of uric acid than those who were not using (p=0.0071).
Conclusion:
This study supports the notion that, in PsA, hyperuricemia is more related to metabolic factors than to disease activity.
1. INTRODUCTION
Psoriatic arthritis (PsA) is a chronic inflammatory disease affecting joints, enthesis and several other organs [1]. In addition, this condition is associated with comorbidities, particularly hypertension, dyslipidemia and obesity, which are traditional cardiovascular risk factors [2].
Gout occurs in 6.02% of patients with PsA [3]. This disease is an inflammatory arthritis caused by the persistent elevation of serum uric acid levels (hyperuricemia), with consequent tissue and joint deposition of monosodium urate (MSU) crystals [4].
Evidence suggests that hyperuricemia affects renal and vascular function, possibly resulting in an increased risk of developing cardiovascular disease in the general population [5]. Two main mechanisms can lead to hyperuricemia: increased uric acid production and reduced renal or extra-renal excretion. Male gender, increasing age, chronic kidney disease, obesity and the consumption of certain foods, drinks and medications are known risk factors for hyperuricemia [6].
It has been demonstrated that uric acid has a role in the pathophysiology of PsA. MSU crystals have been found in psoriatic skin lesions. Moreover, MSU crystals could represent central effectors of cell activation. They activate keratinocytes and epidermal plasmacytoid dendritic cells, leading to the secretion of pro-inflammatory cytokines [7].
The prevalence of hyperuricemia in the United States general population is 20.1% [8]. It has been previously observed that patients with psoriasis and PsA have higher levels of uric acid compared to the general population. The most likely causes are the increased epithelial cell turnover, which leads to greater purine catabolism, the systemic inflammatory state that occurs in these diseases, and the association with components of metabolic syndrome, such as obesity and dyslipidemia [9, 10].
A Canadian study evaluated 265 patients with PsA. Approximately 21% had hyperuricemia, while gout occurred in 0.8%. There was no association between Psoriasis Area and Severity Index score (PASI) and the levels of uric acid. The best predictors of hyperuricemia were elevated creatinine and cholesterol. The authors suggested that hyperuricemia in PsA is similar to that of the general population instead of being associated with increased cell turnover [11].
The prevalence of hyperuricemia in 120 Romanian patients with PsA was 27.5%. There was a significant association with obesity, diabetes and coronary artery disease, but not with skin involvement [12]. In Hong Kong, hyperuricemia occurred in 30.6% of 160 patients with PsA. It was related to Body Mass Index (BMI), but not to the severity of skin disease, joint involvement or renal function [13].
A prior history of psoriasis or PsA is associated with an increased risk of gout. A recent study included 98810 patients from two large cohorts who were monitored for the occurrence of gout. Psoriasis was present in 1621 patients and they had a hazard ratio (HR) of 1.71 for gout compared to individuals without psoriasis. In those with PsA, the incidence was even higher (HR = 4.95) [4]. Another study showed that patients with gout had an increased prevalence of PsA compared with patients without gout (odds ratio 2.50) [14].
It is known that psoriasis, PsA and hyperuricemia are associated with metabolic syndrome and increased cardiovascular risk [4]. A study involving 59 patients with PsA demonstrated that hyperuricemia is an independent risk factor for ventricular extrasystole [15]. A Spanish study used carotid ultrasound to assess subclinical atherosclerosis in 52 patients with PsA. Hyperuricemia occurred in 11.5% of them, and this group had significantly higher values of the intima-media wall thickness of the carotid artery (p = 0.01) [16]. An Egyptian study, which included 60 patients with PsA and 60 controls, showed similar results. Hyperuricemia occurred in 16 (26.6%) of the 60 patients with PsA, and had a positive correlation with the duration of PsA, inflammatory markers and PASI [8]. Finally, a Canadian longitudinal study with 1019 PsA patients showed that hyperuricemia occurred in 32%. Increased uric acid levels were associated with obesity, and this group of patients had more myocardial infarction, heart failure and renal impairment [17].
While some studies have indicated that hyperuricemia is associated mainly with components of the metabolic syndrome [13], others have shown a correlation with the extent of skin disease [17]. However, to our knowledge, no study has used composite disease activity scores, and none has considered individual variable dietary and drinking habits, which may affect uric acid levels. Therefore, the purpose of this study is to determine the relationship between disease activity and uric acid levels, measured by different composite scores.
2. MATERIAL AND METHODS
2.1. Study Design
This cross-sectional, observational study included 52 PsA patients evaluated at PsA Clinic of Hospital de Clínicas - Universidade Federal do Paraná, between April 2017 and December 2018. Patient participation in the study included providing informed consent and completing a questionnaire on demographic data and alcohol consumption, 24-hour dietary recall applied by a nutritionist and clinical evaluation by a rheumatologist. The study protocol was approved by the Ethics Committee of Hospital de Clínicas da Universidade Federal do Paraná (HCUFPR. CAAE: 58538816.0.0000.0096).
2.2. Patients
Eligible patients were ≥18 years of age with a diagnosis of PsA fulfilling CASPAR criteria [18]. No patient included in this study had a history of clinical manifestations of hyperuricemia, including typical gout.
2.3. Procedures
Demographic data, such as sex and age, and medical history data, such as medications in use and self-reported comorbidities, were collected through questionnaire. A nutritionist applied a 24-hour dietary recall [19].
Clinical assessments included BMI, waist circumference, tender and swollen joint counts, PASI [20], Health Assessment Questionnaire Disability Index (HAQ-DI) [20], Visual Analog Scale (VAS) for pain and global activity [20], Leeds Enthesis Index (LEI) [21], Minimal Disease Activity (MDA) [22], Disease Activity Index for Psoriatic Arthritis (DAPSA) [23] and dactylitis count [20, 24]. BMI is calculated as the weight in kilograms (kg) divided by the square of the height in meters (m2). A BMI ≤ 25 kg/m2 was classified as normal, 25–30 kg/m2 was classified as overweight, and BMI ≥ 30 kg/m2 was considered obesity [25]. Waist circumference > 88 cm in females and > 102 cm in males were considered elevated according to The National Cholesterol Education Program Adult Treatment Panel III [26].
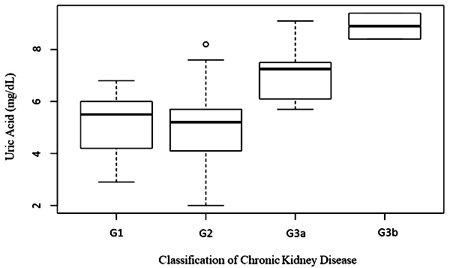
Serum uric acid concentration (SUAC) was measured by the uricase–peroxidase method. Hyperuricemia was defined as SUAC ≥ 6mg/dL in females and ≥ 7mg/dL in males [9, 13]. The high-sensitivity CRP method was immunoturbidimetry, with a reference value <5 mg/L. Creatinine was assessed using the Jaffé method without deproteinization. The estimated glomerular filtration rate (eGFR) in ml/minute/1.73m2 was calculated using the equation Chronic Kidney Disease Epidemiology Collaboration (CKD-EPI) [27]. Chronic kidney disease was classified in G1 if eGFR≥ 90, G2 if eGFR= 60 to 89, G3a if eGF= 45 to 59, G3b if eGFR= 30 to 44, G4 if eGFR 15 to 29 and G5 if eGFR <15 according to the KDIGO clinical practice guideline of chronic kidney disease-mineral and bone disorder (CKD-MBD) [28].
2.4. Statistical Analysis
Quantitative, normally distributed data are presented as means ± standard deviation, and qualitative data as number (percentage). Basic demographics and clinical variables between subjects with or without hyperuricemia were compared using Student’s t-test or Mann–Whitney U-test for variables as appropriate, and Chi-square test or Fisher’s exact test for categorical variables.
3. RESULTS
Among the 52 included patients, 23 (44.23%) were male and 29 (55.76%) were female. The mean age was 54.9 ± 11.6 years.
Hyperuricemia occurred in 14 (26.92%) individuals. The mean value of uric acid was 5.84 ± 1.77mg/dL for men and 5.16 ± 1.35mg/dL for women. The median was 5.45 mg/dL. There was no significant difference in demographic variables between patients with and without hyperuricemia (Table 1). Although BMI was similar between groups, waist circumference was significantly higher in hyperuricemic patients (p=0.0046).
Nutritional assessment was performed in 43 patients, of whom 12 (27.9%) had hyperuricemia and 31 did not. There was no statistically significant difference between individuals with and without hyperuricemia (Table 2). There was no difference in alcohol consumption among the groups.
The most frequent comorbidity was hypertension (53.8%), followed by hyperlipidemia (48.1%). None of the patients had gout. There was no significant difference between the groups, as shown in Table 3. Treatment modalities were similar between groups (Table 4). Individuals using leflunomide had significantly lower levels of uric acid (4.01 ± 1.31) than those who were not using it (mean 5.73 ± 1.49) (p=0.0071).
| - | With Hyperuricemia n=14 (%) |
Without Hyperuricemia n=38 (%) |
p-value |
| Sex | - | - | 1.0a |
| Male | 6 (42.9%) | 17 (44.7%) | - |
| Female | 8 (57.1%) | 21 (55.3%) | - |
| Age † | 52.9 (12.4) | 55.6 (11.3) | 0.47b |
| BMI † | 33.19 (4.15) | 29.44 (5.31) | 0.11c |
| Overweight | 4 (30.8%) | 14 (37.8%) | - |
| Obese | 9 (69.2%) | 15 (40.5%) | - |
| Waist Circumference cm † | 106.2 (9.2) | 96.6 (11.1) | 0.0046b |
| Abnormal Waist Circumference | 13 (92.9%) | 22 (57.9%) | 0.015a |
| Consumption | With Hyperuricemia n=12 (%) |
Without Hyperuricemia n=31 (%) |
p-value |
|---|---|---|---|
| Kcal † | 1475 (476) | 1747 (704) | 0.22a |
| Protein g/day † | 65.1 (24.53) | 75.39 (30.86) | 0.31a |
| Beef g/day † | 75 (91.17) | 67.48 (84.43) | 0.8a |
| Processed meats g/day † | 15 (30) | 5.1 (14.39) | 0.15a |
| Alcohol mL † | 137 (267) | 141 (377) | 0.97a |
| Water mL † | 1643 (1177) | 1121 (759) | 0.092a |
| Organ Meat* | 4 (33.3%) | 9 (29%) | 1b |
| Seafood* | 1 (8.3%) | 6 (19.4%) | 0.65b |
Table 3.
| - | With Hyperuricemia n=14 (%) |
Without Hyperuricemia n=38 (%) |
Total n=52 (%) |
p-value |
|---|---|---|---|---|
| Hypertension | 7 (50.0%) | 21 (55.3%) | 28 (53.8%) | 0.76a |
| Myocardial infarction | 0 (0.0%) | 4 (10.5%) | 4 (7.7%) | 0.56a |
| Nephrolithiasis | 2 (14.3%) | 4 (10.5%) | 6 (11.5%) | 0.65a |
| Diabetes mellitus | 4 (28.6%) | 11 (28.9%) | 15 (28.8%) | 1.00a |
| Hyperlipidemia | 9 (64.3%) | 16 (42.1%) | 25 (48.1%) | 0.21a |
| Osteoporosis | 1 (7.1%) | 5 (13.2%) | 6 (11.5%) | 1.00a |
| - | With Hyperuricemia n=14 (%) |
Without Hyperuricemia n=38 (%) |
p-value |
|---|---|---|---|
| TNF inhibitors | 5 (35.7%) | 17 (44.7%) | 0.75a |
| IL-12/23 inhibitors | 1 (7.1%) | 0 (0.0%) | 0.26a |
| Anti-IL17 | 1 (7.1%) | 1 (2.6%) | 0.47a |
| Tofacitinib | 1 (7.1%) | 0 (0.0%) | 0.26a |
| Methotrexate | 6 (42.9%) | 24 (63.2%) | 0.21a |
| Sulfasalazine | 1 (7.1%) | 0 (0.0%) | 0.26a |
| Leflunomide | 0 (0.0%) | 8 (21.1%) | 0.09a |
| Ciclosporin | 0 (0.0%) | 1 (2.6%) | 1.00a |
| Thiazide | 4 (28.6%) | 7 (18.4%) | 0.45a |
| Acetylsalicylic acid | 4 (28.6%) | 5 (13.2%) | 0.22a |
| ACE inhibitors | 2 (14.3%) | 7 (18.4%) | 1.00a |
| ARB | 1 (7.1%) | 10 (26.3%) | 0.25a |
| Beta blocker | 2 (14.3%) | 8 (21.1%) | 0.70a |
The mean eGFR was 69.6 in the group with hyperuricemia and 83.1 in the group without hyperuricemia (p=0.0837) (Table 5). There was a significant difference in uric acid levels according to the classification of chronic kidney disease by estimated glomerular filtration rate (p=0.0016) (Fig. 1).
| - | With Hyperuricemia n=14 |
Without Hyperuricemia n=38 |
p-value |
|---|---|---|---|
| eGFR † | 69.6 (25.8) | 83.1 (14.9) | 0.0837a |
| Classification of CKD by eGFR † | - | - | <0.001b |
| G1 | 3 (21.4%) | 12 (31.6%) | - |
| G2 | 4 (28.6%) | 25 (65.8%) | - |
| G3a | 5 (35.7%) | 1 (2.6%) | - |
| G3b | 2 (14.3%) | 0 (0%) | - |
| - | With Hyperuricemia n=14 |
Without Hyperuricemia n=38 |
p-value |
|---|---|---|---|
| Tender joints † | 13.2 (17.2) | 10.7 (17.7) | 0.33a |
| Swollen joints † | 1.0 (2.2) | 1.1 (2.0) | 0.48a |
| LEI † | 1.9 (1.8) | 1.3 (2.1) | 0.15a |
| Dactylitis † | 0 (0) | 0 (0) | - |
| VAS pain | 4.5 (3.27) | 4.14 (3.39) | 0.73a |
| VAS global | 5.42 (2.7) | 4.28 (33.42) | 0.2a |
| PASI † | 3.6 (3.8) | 4.2 (6.3) | 0.8a |
| HAQ † | 0.72 (0.83) | 0.51 (0.59) | 0.44a |
| CRP (mg/L) † | 7.9 (11.8) | 5.9 (6.0) | 1.00b |
| MDA | - | - | 0.50b |
| No | 11 (78.6%) | 25 (65.8%) | - |
| Yes | 3 (21.4%) | 13 (34.2%) | - |
| DAPSA † | 24.9 (22.6) | 20.8 (22.6) | 0.34c |
| Remission | 1 (7.1%) | 4 (10.5%) | - |
| Low activity | 4 (28.6%) | 18 (14.4%) | - |
| Moderate activity | 5 (35.7%) | 6 (15.8%) | - |
| High activity | 4 (28.6%) | 10 (26.3%) | - |
The majority (89.6%) of the participants had low cutaneous activity by PASI. The number of tender and swollen joints, enthesis, the mean VAS and PASI were similar between the groups with and without hyperuricemia (Table 6). No study participant had dactylitis at the time of the assessment. Uric acid levels were similar between individuals with active disease and those with minimal disease activity (p=0.5).
LEI indicates Leeds Enthesis Index; VAS, visual analog scale; PASI, psoriasis area and severity index; HAQ, health assessment questionnaire; CRP, C reactive protein; MDA, minimal disease activity; DAPSA, disease activity for psoriatic arthritis.
4. DISCUSSION
To our knowledge, this is the first study to demonstrate that disease activity in PsA, measured by composite scores, does not influence the levels of uric acid. The main strength of the present study is the use of different disease activity scores since PsA is a complex disease that displays variability in both presentation and disease course, including not only synovitis but also inflammation of the digits, enthesis and skin.
The prevalence of hyperuricemia in patients with PsA in this study was 26.92%. This finding is consistent with the results of previous studies, which ranged from 13.5 to 32% [17, 29].
In this study, there was no difference between the groups with and without hyperuricemia regarding demographic factors, such as age, sex or ethnicity. After puberty, hyperuricemia is more frequent in men due to the uricosuric effect of estrogen in women. After menopause, the levels of uric acid increase [30]. The median age of menopause varies between 50 and 52 years [31]. This may justify the absence of a gender difference between the groups with and without hyperuricemia since the average age of the participants in this study was 53.44 years. Our results corroborate the findings that PsA is uncommon in blacks and Asians [32].
Regarding metabolic factors, the mean BMI in this study was greater than 30Kg/m2 and nearly half of the patients were obese. Other studies showed that the prevalence of obesity in PsA ranged from 32.3% to 59.7% [33]. There was no difference between the groups with and without hyperuricemia in terms of BMI classification. This result is contrary to previous studies. However, the hyperuricemia group had a higher waist circumference (p = 0.0046) [13, 17].
Increased waist circumference is a component of metabolic syndrome, as well as hyperglycemia, dyslipidemia and hypertension. This condition is a strong predictor of cardiovascular disease and diabetes mellitus, which are prevalent in patients with PsA. There is evidence that the syndrome is associated with low levels of inflammation since the white adipose tissue secretes cytokines. This contributes to a pro-inflammatory state, which already occurs in PsA [2, 34]. Uric acid is also related to cardiovascular risk factors, but it is not yet known whether it is only a marker or if it has a causal role.
Alcohol increases uric acid production by degrading adenosine triphosphate (ATP). In addition, alcohol consumption leads to dehydration and metabolic acidosis, which result in reduced uric acid excretion. It has been demonstrated in the literature that moderate alcohol consumption does not increase the risk of hyperuricemia [35]. In this study, the groups with and without hyperuricemia had similar alcohol consumption. One possible explanation may be that the majority did not consume alcohol, and few individuals consumed only a moderate amount.
The consumption of protein, beef, organ meats and seafood was similar among individuals with and without hyperuricemia. A Brazilian study involving 1330 participants also found no association between hyperuricemia and alcohol and protein consumption [36]. Previous studies have shown an association between the development of gout and the consumption of red meat and seafood, but not with the amount of protein from other animal or vegetable sources. Little is known regarding the precise amount of purine in most foods, especially if they are processed or cooked [37].
Leflunomide significantly reduced uric acid levels in individuals without hyperuricemia. A possible explanation for this might be the fact that leflunomide increases urate clearance and excretion fraction in the proximal tubule [38]. The reduction in uric acid levels by leflunomide has already been demonstrated in rheumatoid arthritis [39]. None of the patients in the hyperuricemia group was using this medication.
There were no differences in the self-reported comorbidities between the groups. However, patients with lower estimated glomerular filtration rates had higher levels of uric acid (p <0.0016).
Renal excretion corresponds to two-thirds of urate excretion [6]. In the 1980s, it was proposed that hyperuricemia was a consequence of hypertension and reduced kidney function. Therefore, its presence was not considered important in either the pathogenesis or progression of chronic kidney disease [40]. Some recent studies, however, indicate that it may increase the risk of progression of chronic kidney disease [41]. Experimental studies have shown that soluble urate is pro-inflammatory in clinically relevant concentrations in cell culture. In addition, uricosuria can induce tubular injury. These findings have been corroborated by epidemiological studies, which showed that hyperuricemia preceded and predicted the development of chronic kidney disease (CKD). Some pilot studies have even suggested that the reduction of uric acid levels may slow the progression of CKD [40]. Moreover, hyperuricemia is independently associated with an increased risk for the development of nephrolithiasis in a dose-response manner [42].
Although some studies have suggested the hypothesis that increased cell turnover in psoriasis is an important factor in the increase of uric acid, in the present study, this was not confirmed, since PASI score was similar between the groups with and without hyperuricemia [43]. This finding was similar to those found in three other studies [11-13]. It is speculated that cell turnover in psoriasis is not intense enough, as in rhabdomyolysis or tumor lysis syndrome, to significantly increase uric acid values. Another possible explanation could be the fact that the majority of patients in this study had mild cutaneous involvement.
When analyzing disease activity by MDA and DAPSA, there was no statistically significant difference found between groups with and without hyperuricemia. When the components of the activity indexes were analyzed separately, there was no difference observed between the groups regarding the number of tender or swollen joints, enthesis, VAS for both pain and global patient, and CRP. This has also been evidenced by other authors [11-13]
Although this study suggests that uric acid levels do not influence PsA disease activity, in clinical practice, it is still important to detect hyperuricemia and manage it. PsA and gout share common epidemiological features, risk factors, pathophysiology and comorbidities. Moreover, the topographic distribution of PsA arthritis is similar to that found in gout, making it challenging to differentiate a gout attack from a PsA flare, even for trained rheumatologists. Ultrasound and dual-energy computed tomography are imaging modalities occasionally used to differentiate between the two diseases. However, it is still possible that gout and PsA coexist. Interestingly, a recent study has proposed that the concurrence of these two diseases should be seen as a novel overlap syndrome called “psout” [7]. In addition to being associated with gout, hyperuricemia is related to nephrolithiasis and cardiovascular diseases.
The main limitations of this study were the cross-sectional design and convenience sampling.
CONCLUSION
In conclusion, our study supports the notion that, in PsA, hyperuricemia is more related to metabolic factors than to disease activity, but further longitudinal studies are needed to identify causal relationships.
ETHICS APPROVAL AND CONSENT TO PARTICIPATE
This study was approved by the Ethics Committee of Hospital de Clínicas da Universidade Federal do Paraná (HCUFPR. CAAE: 58538816.0.0000.0096).
HUMAN AND ANIMAL RIGHTS
No animals were used in this research. All human research procedures followed were in accordance with the ethical standards of the committee responsible for human experimentation (institutional and national), and with the Helsinki Declaration of 1975, as revised in 2013.
CONSENT FOR PUBLICATION
Written informed consent was obtained from all of the participants, all adults, for interviews. The interviews were kept confidential.
AVAILABILITY OF DATA AND MATERIALS
The data supporting the finding of the article is available in the Zenodo Repository at zenodo.org, reference number http://doi.org/10.5281/zenodo.5112599
FUNDING
Declared none.
CONFLICT OF INTEREST
The author declares no conflict of interest, financial or otherwise.
ACKNOWLEDGEMENTS
Declared none.