All published articles of this journal are available on ScienceDirect.

Efficacy of Etoricoxib, Celecoxib, Lumiracoxib, Non-Selective NSAIDs, and Acetaminophen in Osteoarthritis: A Mixed Treatment Comparison
Abstract
Objective:
To compare the efficacy of etoricoxib, lumiracoxib, celecoxib, non-selective (ns) NSAIDs and acetaminophen in the treatment of osteoarthritis (OA)
Methods:
Randomized placebo controlled trials investigating the effects of acetaminophen 4000mg, diclofenac 150mg, naproxen 1000mg, ibuprofen 2400mg, celecoxib 100-400mg, lumiracoxib 100-400mg, and etoricoxib 30-60mg with treatment duration of at least two weeks were identified with a systematic literature search. The endpoints of interest were pain, physical function and patient global assessment of disease status (PGADS). Pain and physical function reported on different scales (VAS or LIKERT) were translated into effect sizes (ES). An ES 0.2 - 0.5 was defined as a “small” treatment effect, whereas ES of 0.5 – 0.8 and > 0.8 were defined as “moderate” and “large”, respectively. A negative effect indicated superior effects of the treatment group compared to the control group. Results of all trials were analyzed simultaneously with a Bayesian mixed treatment comparison.
Results:
There is a >95% probability that etoricoxib (30 or 60mg) shows the greatest improvement in pain and physical function of all interventions compared. ESs of etoricoxib 30mg relative to placebo, celecoxib 200mg, ibuprofen 2400mg, and diclofenac 150mg were -0.66 (95% Credible Interval -0.83; -0.49), -0.32 (-0.50; -0.14), -0.25 (-0.53; 0.03), and -0.17 (-0.41; 0.08), respectively. Regarding physical functioning, ESs of etoricoxib 30mg relative to placebo, celecoxib 200mg, ibuprofen 2400mg, and diclofenac 150mg were -0.61 (-0.76; -0.46), -0.27 (-0.43; -0.10), -0.20 (-0.47; 0.07), and -0.09 (- 0.33; 0.14) respectively. The greatest improvements in PGADS were expected with either etoricoxib or diclofenac.
Conclusion:
The current study estimated the efficacy of acetaminophen, nsNSAIDs, and COX-2 selective NSAIDs in OA and found that etoricoxib 30 mg is likely to result in the greatest improvements in pain and physical function. Differences in PGADS between interventions were smaller.
INTRODUCTION
Osteoarthritis (OA) is the most common arthritic condition in adults [1]. OA is extremely painful and causes disability and a reduced quality of life, which poses a substantial economic burden for society [2-4].
The principal treatment objectives in OA are to adequately control pain, improve function, and reduce disability. In order to achieve this, analgesic medication including acetaminophen, non-selective non-steroidal anti-inflammatory drugs (nsNSAIDs) and more recently cyclooxygenase (COX) 2 selective NSAIDs are commonly prescribed in the treatment of OA [5]. Acetaminophen is used at a maximum recommended dose of 4000 mg/day and nsNSAIDs like naproxen at 1000 mg/day, diclofenac 150 mg/day and ibuprofen 2400 mg/day. A Cochrane review demonstrated that NSAIDs display superior efficacy relative to acetaminophen [6]. However, concern for gastrointestinal complications is a major factor limiting the use of nsNSAIDs at various doses [5]. The COX 2 selective class of NSAIDs were developed to decrease the risk of gastrointestinal tract injury; in OA the recommended daily doses are: celecoxib 200mg, etoricoxib 30-60mg and lumiracoxib 100mg. (At the time of the writing of this manuscript (December 2007), the EMEA CHMP has recommended the withdrawal of the marketing authorisations for all lumiracoxib-containing medicines, because of the risk of serious side effects affecting the liver. [7])
Medical decision making requires the assessment of the relative value of an intervention versus relevant comparators (e.g., COX 2 selective inhibitors, NSAIDs and paracetamol). A comprehensive relevant comparison in OA requires considering all available best evidence (i.e. all RCTs) of the above mentioned interventions. Ideally, we want a RCT that compares all interventions of interest simultaneously. However, such a study has not been performed. A mixed treatment comparison (MTC) is a valuable alternative to synthesis evidence when the interest is to compare multiple interventions of different RCTs [8]. MTC is an extension of traditional meta-analysis by including multiple different pair-wise comparisons across a range of interventions [8-11]. With MTC the relative efficacy of a particular intervention versus competing interventions can be obtained in the absence of head-to-head comparisons; an indirect comparison of two interventions is made via a common comparator. A Bayesian approach to a MTC can be considered the method of choice because it allows for a probabilistic interpretation and therefore leads naturally into the decision making context. The ranking of interventions regarding their ability of providing greatest outcomes becomes particularly useful.
The objective of the current study was to evaluate the efficacy of acetaminophen 4000mg, the nsNSAIDs diclofenac 150mg, naproxen 1000mg, and ibuprofen 2400mg, and the COX-2 selective NSAIDs celecoxib and lumiracoxib at doses ranging from 100 to 400mg and etoricoxib 30mg and 60mg in the treatment of OA.
MATERIALS AND METHODS
Identification and Selection of Studies
In order to identify relevant publications a systematic literature review was performed. Computerised bibliographic databases (MEDLINE 1966 – 14th December 2006 November, EMBASE 1980 – 23rd November 2006 and Cochrane Library issue 4 (central register of clinical trials and systematic reviews, until 14th December 2006) were searched. The following search terms were used: celecoxib; Celebrex; lumiracoxib; Prexige; etoricoxib; Arcoxia; acetaminophen; paracetamol; diclofenac; naproxen; ibuprofen, randomized method; randomized trial; randomised method; randomised controlled trial; controlled trial; controlled study; controlled studies; clinical trial; clinical study; double blind. In addition, trials from the etoricoxib development program were included. The identified studies were included according to the following predetermined conditions:
Type of design
– Randomised controlled trials with a double blind period. Only full-published reports were considered; letters and abstracts were excluded.
Intervention
– The interventions included acetaminophen 4000mg/day, ibuprofen 2400mg/day, naproxen 1000mg/day, diclofenac 150mg/day, celecoxib 100, 200 or 400 mg/day, etoricoxib 30 and 60 mg/day. The duration of the intervention was at least 2 weeks.
Comparison
– Acetaminophen, a non selective NSAID or a COX-2 selective NSAID at mentioned dosage or placebo.
Study population
– All OA patients, with knee and/or hip as the primary affected joint.
Outcome measures
– In accordance with recommendations of OMERACT (Outcome Measures in Rheumatology Clinical Trials) the outcome measures included were: pain, physical function and patient global assessment [12]. The outcomes pain and physical function were required to be assessed by the Western Ontario and McMaster Universities Osteoarthritis Index (WOMAC) scales.
Language
– Full-published reports in English were considered.
Data Extraction
For each selected study, details were extracted on design, selection criteria, study population characteristics, interventions, outcome measures, length of follow-up, and results, which were subsequently checked by a second reviewer. With regard to etoricoxib the original company trial reports were available to extract outcome data. The outcome measures of interest were the change from baseline (CFB) in pain, physical functioning, and patient global assessment of disease status (PGADS) reported at the last available follow-up measurement of the double-blind randomized period of the RCTs. To compare VAS and likert scales for pain and physical function across studies and combine them in the MTC, CFB values were translated into effect sizes (ES) [13]. Relative ES were calculated as the difference in CFB between two interventions divided by the corresponding standard deviation. If the standard deviation was not reported, the ES was calculated by conversion of the reported P value to a Z-statistic according to: ES = z √(1/n1 +1/n2), where n1 and n2 are the number of patients in the groups that are compared. For studies that report cut-off P values, the quoted value (e.g., 0.05) was used to estimate the ES.
Analysis
The results of the different regimens in the included studies were combined by means of a Bayesian MTC and as a result, estimates of relative efficacy between each of the possible pair-wise comparisons were obtained [8-11]. The interventions were acetaminophen 4000 mg/day, diclofenac 150 mg/day, naproxen 1000 mg/day, ibuprofen 2400 mg/day, dexibuprofen 800mg/day, celecoxib 100, 200 or 400 mg/day, etoricoxib 30 mg/day and 60 mg/day and lumiracoxib 100, 200 or 400 mg/day. Analyses were performed for pain, physical function, and PGADS.
MTC within the Bayesian framework involve data, a likelihood distribution, a model with parameters, and prior distributions for these parameters. The model relates the data from the individual studies to basic parameters reflecting the (pooled) relative treatment effect of each intervention compared to placebo. Based on these basic parameters, the relative efficacy between each of the competing interventions was estimated. For the 3 outcomes of interest, linear models with normal likelihood distributions were used. A MTC relies on the assumption that there are no differences in the distribution of modifiers of the relative treatment effects across comparisons. For the current analyses comparability of studies was not of concern and as such no treatment-by-covariate interactions were incorporated in the models [8-11]. As with any meta-analysis, MTC can be performed with a fixed effects approach or a random effects approach. With a fixed effects model it is assumed that there is no heterogeneity in relative treatment effects across studies within comparisons. With a random effects model however, heterogeneity in study-specific treatment effects is taken into account [8-11]. For the current analyses random effects models were used.
In order to avoid that the prior beliefs influence the results of the model, non-informative prior distributions were used. Prior distributions of the relative treatment effects were normal distributions with mean 0 and a variance of 10,000. A uniform distribution with range of 0-5 was used for the prior distribution of heterogeneity. The posterior distribution can be interpreted in terms of probabilities and allows calculating the probability that each treatment is best out of those compared given the data at hand [8-11].
Analyses were performed with WinBUGS 1.4 statistical software. Results were presented with summary statistics for the ES for pain and physical function and CFB treatment effects for PGADS: point estimate reflecting the most likely value along with 95% credible intervals (95% CrI) reflecting the range of true effects with 95% probability. Negative treatment effects indicate symptomatic improvement. (CrI instead of confidence interval are used to differentiate the uncertainty obtained with a Bayesian approach from that obtained with a frequentist approach.) In addition, the probability that a certain treatment out of all those compared provided greatest improvements in pain, physical functioning and PGADS was calculated. Probabilities of a ‘clinical relevant’ benefit were calculated as well. For this purpose an ES of ≥ 0.8 was defined as a “large” treatment effect. ES of 0.5 and 0.2 were defined as “moderate” and “small”, respectively [13]. Furthermore, in accordance with the Osteoarthritis Research Society International (OARSI) responder criteria, a relative CFB ≥ 10 mm was considered a clinical significant response for PGADS [14].
RESULTS
Literature Search
With the literature search 4347 citations in OA were identified. After evaluation of the abstracts according to the predefined selection criteria, 28 citations (=30 studies) were identified as potential relevant and full text reports were obtained [15-42] in addition to 8 studies from the etoricoxib development program [43-48]. After evaluation of the full reports, 9 publications were excluded since they reported different outcomes [15,16], did not consider the appropriate doses of the treatment under study [17], were shorter than 2 weeks [18,19], reported the outcomes of pain and physical function not according to the WOMAC scales or subscales [20,21] and did not report the results per intervention [22]. Since the trials from Zhao et al., [23] and Bensen et al., [24] were duplicate reports of one trial, only Bensen et al., [24] was included. Overall 29 studies (of which 28 were reported in 25 publications) were included in the analysis [24-48].
Table 1 displays an overview of the included studies and interventions. Overall, the analysis included over 18,000 patients. Double blind treatment periods ranged from 2 to 13 weeks. The baseline characteristics of the patients in the different trials were comparable. The average age was about 63 years. All patients suffered from OA for more than 3.5 years, with an average duration of 8.7 years. Baseline scores of pain and physical functioning were comparable across the trials as well. In Tables 2-4 individual study results in terms of ESs and CFB are presented (along with the uncertainty expressed as standard errors).
Overview of Study Design, Baseline Characteristics and Scales Used to Measure Pain and Physical Functioning
| Length of Double Blind TX Period | Joints | Randomized Patients Number | Age | Duration of OA (Years) | Scale | Pain | Physical Functioning | PGADS | ||||||||
|---|---|---|---|---|---|---|---|---|---|---|---|---|---|---|---|---|
| N tot | N | Mean | SD | Mean | SD | Mean | SD | Mean | SD | Mean | SD | |||||
| Bensen [24] | Placebo | 12wk | knee | 1003 | 203 | 62.0 | 12.2 | 11.0 | 8.0 | WOMAC Likert (pain 0-20, function 0-68) | 10.7 | 4.7 | 36.1 | 14.7 | ||
| celecoxib 100 mg | 203 | 62.0 | 17.3 | 9.0 | 8.0 | 10.7 | 4.7 | 36.1 | 14.7 | |||||||
| celecoxib 200 mg | 197 | 62.0 | 13.3 | 10.0 | 8.0 | 10.7 | 4.7 | 36.1 | 14.5 | |||||||
| celecoxib 400 mg | 202 | 63.0 | 15.8 | 9.0 | 9.0 | 10.7 | 4.7 | 36.1 | 14.6 | |||||||
| naproxen 1000mg | 198 | 62.0 | 12.2 | 10.0 | 8.0 | 10.7 | 4.7 | 36.1 | 17.5 | |||||||
| Birbara Study 1 [35] | Placebo | 6 wks | knee | 395 | 78 | 60.5 | 11.6 | WOMAC VAS (0-100mm) | 68.5 | 17.0 | 65.0 | 19.4 | ||||
| celecoxib 200 mg | 157 | 61.3 | 9.2 | 68.3 | 17.0 | 67.5 | 17.5 | |||||||||
| Birbara Study 2 [35] | Placebo | 85 | 60.4 | 11.2 | WOMAC VAS (0-100mm) | 68.7 | 17.6 | 65.1 | 19.4 | |||||||
| celecoxib 200 mg | 169 | 60.7 | 11.2 | 66.8 | 17.3 | 63.1 | 19.8 | |||||||||
| Case [36] | Placebo | 12 wks | knee | 82 | 28 | 61.7 | 9.0 | WOMAC VAS | 198.6 | 110.9 | 697.1 | 375.2 | ||||
| aceta.phen.4000mg | 29 | 62.1 | 11.4 | 210.8 | 86.3 | 657.0 | 262.5 | |||||||||
| diclofenac 150 mg | 25 | 62.9 | 7.6 | 199.8 | 101.5 | 669.3 | 371.6 | |||||||||
| Fleischmann [27] | Placebo | 13 wks | knee | 1608 | 231 | 61.5 | 11.7 | 6.6 | 7.0 | WOMAC Likert (pain 0-20, function 0-68) | 9.9 | 3.3 | 33.0 | 8.5 | ||
| lumiracoxib200 mg | 462 | 61.1 | 11.1 | 6.1 | 7.2 | 10.3 | 3.2 | 32.0 | 8.3 | |||||||
| lumiracoxib400 mg | 463 | 60.8 | 11.5 | 6.4 | 7.0 | 9.9 | 3.4 | 33.7 | 8.6 | |||||||
| celecoxib 200 mg | 444 | 61.3 | 11.1 | 6.7 | 8.1 | 10.3 | 3.3 | 33.0 | 8.7 | |||||||
| Geba [34] | acetaminph.4000 mg | 6 wks | knee | 382 | 94 | 63.1 | 10.9 | WOMAC VAS (0-100mm) | ||||||||
| celecoxib200 mg | 97 | 62.6 | 11.0 | |||||||||||||
| Gibofsky [25] | placebo150 mg | 6 wks | knee | 475 | 96 | 63.1 | 9.9 | 8.3 | 7.9 | WOMAC Likert (pain 0-20, function 0-68) | 11.0 | 0.3 | 38.4 | 1.0 | ||
| celecoxib 200 mg | 189 | 62.2 | 10.5 | 8.6 | 8.1 | 11.2 | 0.3 | 38.8 | 0.8 | |||||||
| Kivitz [31] | Placebo | 12 wks | hip | 1061 | 218 | 64.0 | 7.9 | WOMAC Likert (pain 0-20, function 0-68) | 10.5 | 7.2 | 35.3 | 14.7 | ||||
| celecoxib 100 mg | 216 | 65.0 | 7.3 | 10.5 | 7.2 | 33.8 | 14.7 | |||||||||
| celecoxib200 mg | 207 | 65.0 | 7.2 | 10.5 | 7.0 | 35.3 | 14.4 | |||||||||
| celecoxib 400 mg | 213 | 67.0 | 6.9 | 10.8 | 7.1 | 34.5 | 14.6 | |||||||||
| naproxen 1000 mg | 207 | 66.0 | 7.3 | 10.5 | 7.0 | 34.5 | 14.4 | |||||||||
| Lehmann [39] | placebo | 13 wks | knee | 1684 | 424 | 61.7 | 10.2 | 3.9 | 5.4 | WOMAC Likert (pain 0-20, function 0-68) | 9.8 | 3.2 | 35.8 | 10.8 | ||
| lumiracoxib 100 mg | 420 | 62.2 | 10.0 | 4.4 | 5.7 | 9.9 | 3.2 | 35.3 | 11.5 | |||||||
| celecoxib 200 mg | 420 | 62.9 | 10.5 | 4.4 | 6.2 | 10.2 | 3.2 | 36.2 | 10.8 | |||||||
| Lisse [38] | placebo | 12 | knee+hip | 768 | 188 | 74.4 | 3.9 | 9.4 | 10.2 | WOMAC Likert (pain 0-20, function 0-68) | 9.9 | 3.2 | 33.6 | 11.3 | ||
| celecoxib 200mg | 191 | 75.0 | 4.0 | 10.0 | 8.9 | 10.3 | 3.3 | 35.0 | 10.7 | |||||||
| celecoxib 400mg | 183 | 75.0 | 4.0 | 10.3 | 9.6 | 10.3 | 3.2 | 35.5 | 11.1 | |||||||
| naproxen 1000 mg | 206 | 75.0 | 4.1 | 10.4 | 10.7 | 10.4 | 3.4 | 34.5 | 11.1 | |||||||
| McKenna [40] | placebo | 6wks | knee | 600 | 200 | 60.5 | 34-88 | WOMAC Likert (pain 0-20, function 0-68) | 10.7 | 3.3 | 37.4 | 11.9 | ||||
| celecoxib 200 mg | 201 | 63.0 | 32-85 | 10.6 | 3.1 | 37.4 | 10.4 | |||||||||
| diclofenac 150 mg | 199 | 63.0 | 29-87 | 10.7 | 3.1 | 37.5 | 10.4 | |||||||||
| Miceli-Richard [32] | placebo | 6 wks | knee | 779 | 374 | 70.0 | 11.0 | 3.8 | 4.0 | WOMAC VAS (0-100mm) | 69.0 | 17.0 | 54.0 | 15.0 | ||
| acetaminph.4000 mg | 405 | 69.0 | 12.0 | 3.8 | 3.8 | 66.7 | 18.0 | 54.0 | 15.0 | |||||||
| Schnitzer [33] | Placebo | 4 wks | knee+hip | 484 | 97 | 61.5 | 9.3 | 8.0 | WOMAC Likert (pain 0-20, function 0-68) | 9.6 | 3.5 | 32.7 | 10.4 | 62.5 | 18.1 | |
| lumiracoxib 100 mg | 98 | 61.3 | 8.5 | 7.4 | 9.8 | 3.6 | 31.8 | 12.1 | 63.1 | 17.5 | ||||||
| lumiracoxib 200 mg | 96 | 59.8 | 9.4 | 6.6 | 9.6 | 3.0 | 31.1 | 11.3 | 62.0 | 18.5 | ||||||
| lumiracoxib 400 mg 2*dd | 99 | 59.6 | 9.9 | 6.9 | 9.6 | 3.7 | 31.5 | 11.8 | 64.0 | 17.3 | ||||||
| diclofenac 150 mg | 94 | 59.7 | 8.6 | 6.3 | 9.5 | 3.4 | 31.1 | 12.6 | 62.2 | 16.2 | ||||||
| Sheldon [28] | Placebo | 13 wks | knee | 1551 | 382 | 60.8 | 10.5 | 7.0 | 7.4 | WOMAC Likert (pain 0-20, function 0-68) | 11.0 | 2.9 | 37.2 | 10.5 | ||
| lumiracoxib 100 mg | 391 | 60.2 | 11.1 | 6.9 | 7.7 | 10.8 | 3.1 | 37.3 | 9.8 | |||||||
| celecoxib 200 mg | 393 | 60.2 | 10.5 | 6.7 | 7.5 | 10.8 | 3.2 | 36.9 | 11.0 | |||||||
| Smugar Study 1 [26] | Placebo | 6 wks | knee+hip | 1521 | 150 | 61.8 | WOMAC VAS (0-100mm) | |||||||||
| celecoxib 200 mg | 456 | 61.8 | ||||||||||||||
| Smugar Study 2 [26] | placebo 150 mg | knee+hip | 1082 | 151 | 62.5 | WOMAC VAS (0-100mm) | ||||||||||
| celecoxib 200 mg | 460 | 62.0 | ||||||||||||||
| Tannenbaum [29] | Placebo | 13 wks | knee | 1702 | 243 | 64.6 | 9.9 | 4.3 | WOMAC Likert (pain 0-20, function 0-68) | 10.3 | 3.0 | 34.6 | 10.4 | |||
| lumiracoxib 200 mg | 487 | 64.1 | 10.7 | 4.2 | 10.1 | 3.4 | 34.6 | 11.2 | ||||||||
| lumiracoxib 400 mg | 491 | 64.3 | 10.4 | 5.2 | 10.0 | 3.3 | 33.9 | 11.4 | ||||||||
| celecoxib 200 mg | 481 | 64.1 | 10.4 | 5.3 | 10.1 | 3.3 | 34.4 | 11.7 | ||||||||
| Williams [41] | Placebo | 6 wks | knee | 686 | 232 | 62.6 | 11.3 | 8.6 | 8.2 | WOMAC Likert (pain 0-20, function 0-68) | 10.3 | 3.5 | 34.9 | 12.0 | ||
| celecoxib 200mg QD | 223 | 62.7 | 10.9 | 8.8 | 7.7 | 10.2 | 3.7 | 34.3 | 12.2 | |||||||
| Williams [42] | Placebo | 6 wk | knee | 718 | 244 | 61.3 | 11.6 | 9.7 | 8.7 | WOMAC Likert (pain 0-20, function 0-68) | 10.5 | 3.3 | 37.5 | 11.2 | ||
| celecoxib 200mg (QD) | 231 | 61.3 | 12.2 | 9.4 | 8.1 | 10.1 | 3.5 | 35.9 | 11.9 | |||||||
| p007 [44] | Placebo | 14 wks | knee | 617 | 60 | 62.5 | 9.8 | 7.2 | 6.8 | WOMAC VAS [0-100mm] | 71.3 | 70.9 | 70.4 | |||
| etoricoxib 30 mg | 102 | 61.3 | 10.7 | 8.9 | 7.9 | 67.6 | 65.6 | 66.3 | ||||||||
| etoricoxib 60 mg | 112 | 60.0 | 9.6 | 7.6 | 6.9 | 66.4 | 63.7 | 64.7 | ||||||||
| P018 | placebo | 12 wks | knee+hip | 496 | 56 | 7.9 | 7.2 | WOMAC VAS [0-100mm] | 71.1 | 68.0 | 71.8 | |||||
| etoricoxib 60 mg | 222 | 7.1 | 6.9 | 68.9 | 66.4 | 67.6 | ||||||||||
| naproxen 1000 mg | 218 | 7.3 | 8.4 | 69.0 | 66.2 | 68.7 | ||||||||||
| p019 [45] | placebo | 12 wks | knee+hip | 501 | 56 | 64.1 | 8.9 | 6.3 | 6.4 | WOMAC VAS [0-100mm] | 68.7 | 69.0 | 73.6 | |||
| etoricoxib 60 mg | 224 | 62.9 | 9.2 | 5.9 | 6.0 | 64.9 | 64.0 | 66.9 | ||||||||
| naproxen 1000 mg | 221 | 63.2 | 9.3 | 6.3 | 6.5 | 65.7 | 63.7 | 67.8 | ||||||||
| P071 [43] | Placebo | 12 wks | knee+hip | 528 | 104 | 59.5 | 8.4 | 6.9 | 6.8 | WOMAC VAS [0-100mm] | 69.5 | 70.1 | 72.6 | |||
| Etoricoxib 30 mg | 214 | 63.1 | 10.6 | 7.9 | 8.6 | 68.7 | 68.1 | 72.2 | ||||||||
| Ibuprofen 2400 mg | 210 | 61.3 | 9.6 | 8.2 | 7.7 | 67.8 | 67.8 | 70.5 | ||||||||
| P073 [47] | Placebo | 12 wks | knee+hip | 548 | 111 | 64.0 | 10.1 | 6.5 | 6.6 | WOMAC VAS [0-100mm] | 64.7 | 64.2 | 66.9 | |||
| Etoricoxib 30 mg | 224 | 62.1 | 9.0 | 6.6 | 7.3 | 66.5 | 64.3 | 70.1 | ||||||||
| Ibuprofen 2400 mg | 213 | 62.3 | 9.6 | 6.7 | 8.1 | 64.7 | 62.5 | 69.9 | ||||||||
| P076 [48] | Placebo | 12 wks | knee+hip | 599 | 127 | 62.8 | 9.7 | 9.0 | 8.7 | WOMAC VAS [0-100mm] | 66.6 | 64.7 | 69.1 | |||
| Etoricoxib 30mg | 231 | 62.1 | 10.2 | 8.6 | 8.9 | 67.4 | 65.5 | 72.2 | ||||||||
| Celecoxib 200mg | 241 | 62.5 | 9.3 | 8.4 | 8.7 | 67.5 | 66.6 | 71.3 | ||||||||
| P077 [48] | Placebo | 12 wks | knee+hip | 608 | 117 | 60.9 | 8.6 | 7.2 | 6.6 | WOMAC VAS [0-100mm] | 66.4 | 65.2 | 72.3 | |||
| Etoricoxib 30mg | 243 | 61.9 | 9.6 | 7.8 | 8.3 | 68.7 | 67.7 | 73.0 | ||||||||
| Celecoxib 200mg | 247 | 62.2 | 9.5 | 8.3 | 8.7 | 67.3 | 65.8 | 70.1 | ||||||||
| Schnitzer [37] | acetaminph. 4000 mg | 6 wks | knee | 1578 | 269 | 61.9 | 10.7 | WOMAC VAS [0-100mm] | ||||||||
| celecoxib 200 mg | 523 | 61.4 | 9.9 | |||||||||||||
| Hawel [30] | dexibuprofen800 mg | 15 days | hip | 148 | 74 | 55.3 | 10.1 | WOMAC LIKERT [pain 0-20, function 0-68] | 10.5 | 2.3 | 36.9 | 7.8 | ||||
| celecoxib200mg | 74 | 53.2 | 9.4 | 10.4 | 2.4 | 36.8 | 9.6 | |||||||||
| 805-01 [46] | etoricoxib 60 mg | 6 wks | knee+hip | 516 | 256 | 63.1 | 9.7 | 7.5 | 6.8 | WOMAC VAS [0-100mm] | 62.8 | 17.0 | 62.7 | 18.2 | 70.7 | 17.2 |
| Diclofenac-sodium 150 mg | 260 | 63.0 | 9.8 | 7.5 | 6.6 | 62.0 | 17.5 | 59.9 | 18.5 | 69.0 | 17.1 | |||||
Overview of the Treatment Effects (Effect Sizes) Versus Placebo or Active Intervention by Study for Pain
| Placebo | Acetaminophen 4000 | Naproxen 1000 | Ibuprofen 2400 | Dexibuprofen 800 | Diclofenac 150 | Celecoxib 100 | Celecoxib 200 | Celecoxib 400 | Lumiracoxib 100 | Lumiracoxib 200 | Lumiracoxib 400 | Etoricoxib 30 | Etoricoxib 60 | |||||||||||||
|---|---|---|---|---|---|---|---|---|---|---|---|---|---|---|---|---|---|---|---|---|---|---|---|---|---|---|
| ES* | se | ES | se | ES | se | ES | se | ES | se | ES | se | ES | se | ES | Se | ES | se | ES | se | ES | se | ES | Se | |||
| Bensen [24] | Ref | -0.16 | 0.1 | -0.14 | 0.1 | -0.34 | 0.1 | -0.27 | 0.1 | |||||||||||||||||
| Birbara Study 1 [35] | Ref | -0.16 | 0.14 | |||||||||||||||||||||||
| Birbara Study 2 [35] | Ref | -0.19 | 0.13 | |||||||||||||||||||||||
| Case [36] | Ref | -0.09 | 0.27 | -0.43 | 0.28 | |||||||||||||||||||||
| Fleischmann [27] | Ref | -0.3 | 0.08 | -0.34 | 0.08 | -0.34 | 0.08 | |||||||||||||||||||
| Geba [34]*** | 0.16 | 0.15 | Ref | |||||||||||||||||||||||
| Gibofsky [25] | Ref | -0.52 | 0.13 | |||||||||||||||||||||||
| Kivitz [31] | Ref | -0.2 | 0.1 | -0.08 | 0.1 | -0.14 | 0.1 | -0.17 | 0.1 | |||||||||||||||||
| Lehmann [39] | Ref | -0.23 | 0.07 | -0.22 | 0.07 | |||||||||||||||||||||
| Lisse [38] | Ref | -0.31 | 0.1 | -0.32 | 0.1 | -0.32 | 0.1 | |||||||||||||||||||
| McKenna [40] | Ref | -0.45 | 0.1 | -0.39 | 0.1 | |||||||||||||||||||||
| Miceli- Richard [32] | Ref | 0.00 | 0.07 | |||||||||||||||||||||||
| Schnitzer [33] | Ref | -0.4 | 0.15 | -0.42 | 0.15 | -0.3 | 0.15 | -0.37 | 0.15 | |||||||||||||||||
| Sheldon [28] | Ref | -0.27 | 0.07 | -0.32 | 0.07 | |||||||||||||||||||||
| Smugar study 1 [26] | Ref | -0.51 | 0.09 | |||||||||||||||||||||||
| Smugar study 2 [26] | Ref | -0.65 | 0.1 | |||||||||||||||||||||||
| Tannenbaum [29] | Ref | -0.18 | 0.08 | -0.19 | 0.08 | -0.21 | 0.08 | |||||||||||||||||||
| Williams [41] | Ref | -0.32 | 0.09 | |||||||||||||||||||||||
| Williams [42] | Ref | -0.29 | 0.09 | |||||||||||||||||||||||
| P007 [44] | Ref | -0.67 | 0.17 | -1.08 | 0.17 | |||||||||||||||||||||
| P018 [np] | Ref | -0.79 | 0.15 | -0.66 | 0.15 | |||||||||||||||||||||
| P019 [45] | Ref | -0.5 | 0.15 | -0.52 | 0.15 | |||||||||||||||||||||
| P071 [43] | Ref | -0.43 | 0.12 | -0.51 | 0.12 | |||||||||||||||||||||
| P073 [47] | Ref | -0.38 | 0.12 | -0.58 | 0.12 | |||||||||||||||||||||
| P076 [48] | Ref | -0.56 | 0.11 | -0.7 | 0.11 | |||||||||||||||||||||
| P077 [48] | Ref | -0.55 | 0.12 | -0.69 | 0.12 | |||||||||||||||||||||
| Schnitzer 2005 *** [37] | 0.21 | 0.08 | Ref | |||||||||||||||||||||||
| Hawel [30] **** | Ref | 0.05 | 0.18 | |||||||||||||||||||||||
| 805-01***** [46] | Ref | -0.02 | 0.09 | |||||||||||||||||||||||
* ES=Effect size. small (ES ≥ 0.2), moderate (ES ≥ 0.5) or large ((ES ≥ 0.8). negative effect sizes indicate improvement
** se = standard error of the effect size
*** Versus celecoxib 200
**** versus dexibuprofen 800
***** versus diclofenac 150.
Overview of the Treatment Effects (Effect Sizes) Versus Placebo or Active Intervention by Study for Physical Function
| Placebo | Acetaminophen 4000 | Naproxen 1000 | Ibuprofen 2400 | Dexibuprofen 800 | Diclofenac 150 | Celecoxib 100 | Celecoxib 200 | Celecoxib 400 | Lumiracoxib 100 | Lumiracoxib 200 | Lumiracoxib 400 | Etoricoxib 30 | Etoricoxib 60 | |||||||||||||
|---|---|---|---|---|---|---|---|---|---|---|---|---|---|---|---|---|---|---|---|---|---|---|---|---|---|---|
| ES | se | ES | se | ES | se | ES | se | ES | se | ES | se | ES | se | ES | se | ES | se | ES | se | ES | se | ES | se | |||
| Bensen [24] | Ref | -0.14 | 0.1 | -0.1 | 0.1 | -0.29 | 0.1 | -0.2 | 0.1 | |||||||||||||||||
| Birbara Study 1 [35] | Ref | -0.15 | 0.14 | |||||||||||||||||||||||
| Birbara Study 2 [35] | Ref | -0.15 | 0.13 | |||||||||||||||||||||||
| Case [36] | Ref | 0.2 | 0.27 | -0.36 | 0.28 | |||||||||||||||||||||
| Fleischmann [27] | Ref | -0.39 | 0.08 | -0.49 | 0.08 | -0.46 | 0.08 | |||||||||||||||||||
| Geba [34]*** | 0.24 | 0.15 | Ref | |||||||||||||||||||||||
| Gibofsky [25] | Ref | -0.48 | 0.13 | |||||||||||||||||||||||
| Kivitz [31] | Ref | -0.31 | 0.1 | -0.19 | 0.1 | -0.24 | 0.1 | -0.25 | 0.1 | |||||||||||||||||
| Lehmann [39] | Ref | -0.19 | 0.07 | -0.18 | 0.07 | |||||||||||||||||||||
| Lisse [38] | Ref | -0.31 | 0.1 | -0.32 | 0.1 | -0.32 | 0.1 | |||||||||||||||||||
| McKenna [40] | Ref | -0.53 | 0.1 | -0.4 | 0.1 | |||||||||||||||||||||
| Miceli-Richard [32] | Ref | 0.00 | 0.07 | |||||||||||||||||||||||
| Schnitzer [33] | Ref | -0.38 | 0.15 | -0.32 | 0.15 | -0.17 | 0.15 | -0.35 | 0.15 | |||||||||||||||||
| Sheldon [28] | Ref | -0.36 | 0.07 | -0.45 | 0.07 | |||||||||||||||||||||
| Smugar study 1 [26] | Ref | -0.51 | 0.09 | |||||||||||||||||||||||
| Smugar study 2 [26] | Ref | -0.64 | 0.1 | |||||||||||||||||||||||
| Tannenbaum [29] | Ref | -0.26 | 0.08 | -0.3 | 0.08 | -0.28 | 0.08 | |||||||||||||||||||
| Williams [41] | Ref | -0.26 | 0.09 | |||||||||||||||||||||||
| Williams [42] | Ref | -0.2 | 0.09 | |||||||||||||||||||||||
| P007 [35] | Ref | -0.59 | 0.17 | -0.96 | 0.17 | |||||||||||||||||||||
| P018 [np] | Ref | -0.89 | 0.16 | -0.79 | 0.15 | |||||||||||||||||||||
| P019 [45] | Ref | -0.42 | 0.15 | -0.42 | 0.15 | |||||||||||||||||||||
| P071 [43] | Ref | -0.46 | 0.12 | -0.5 | 0.12 | |||||||||||||||||||||
| P073 [47] | Ref | -0.36 | 0.12 | -0.51 | 0.12 | |||||||||||||||||||||
| P076 [48] | Ref | -0.57 | 0.11 | -0.72 | 0.11 | |||||||||||||||||||||
| P077 [48] | Ref | -0.61 | 0.12 | -0.71 | 0.12 | |||||||||||||||||||||
| Schnitzer 2005*** [37] | 0.24 | 0.08 | Ref | |||||||||||||||||||||||
| Hawel [30]**** | Ref | 0.01 | 0.18 | |||||||||||||||||||||||
| 805-01***** [46] | Ref | -0.02 | 0.09 | |||||||||||||||||||||||
* ES=Effect size. small (ES ≥ 0.2), moderate (ES ≥ 0.5) or large ((ES ≥ 0.8). negative effect sizes indicate improvement
** se = standard error of the effect size.
*** versus celecoxib 200
**** versus dexibuprofen 800
***** versus diclofenac 150.
Overview of the Treatment Effects Versus Placebo or Active Intervention by Study for PGADS Expressed as Difference in Change from Baseline
| Placebo | Naproxen 1000 | Ibuprofen 2400 | Diclofenac 150 | Celecoxib 100 | Celecoxib 200 | Lumiracoxib 100 | Lumiracoxib 200 | Lumiracoxib 400 | Etoricoxib 30 | Etoricoxib 60 | |||||||||||
|---|---|---|---|---|---|---|---|---|---|---|---|---|---|---|---|---|---|---|---|---|---|
| diff CFB* | se | diff CFB | se | diff CFB | se | diff CFB | se | diff CFB | se | diff CFB | se | diff CFB | se | diff CFB | se | diff CFB | se | diff CFB | se | ||
| Schnitzer [33] | Ref | -15.3 | 3.65 | -11.8 | 3.59 | -11.7 | 3.67 | -14 | 3.74 | ||||||||||||
| Smugar study 1 [26] | Ref | -14.5 | 2.21 | ||||||||||||||||||
| Smugar study 2 [26] | Ref | -16.1 | 2.21 | ||||||||||||||||||
| P007 [44] | Ref | -16.3 | 3.57 | -25.3 | 3.54 | ||||||||||||||||
| P018 [np] | Ref | -18.6 | 3.29 | -16.6 | 3.29 | ||||||||||||||||
| P019 [45] | Ref | -7.6 | 3.16 | -9.3 | 3.16 | ||||||||||||||||
| P071 [43] | Ref | -11.4 | 2.66 | ||||||||||||||||||
| P073 [47] | Ref | -8.1 | 2.65 | -11.7 | 2.63 | ||||||||||||||||
| P076 [48] | Ref | -12.4 | 2.47 | -16.4 | 2.48 | ||||||||||||||||
| P077 [48] | Ref | -15.9 | 2.55 | -15.9 | 2.56 | ||||||||||||||||
| 805-01*** [46] | Ref | 0.2 | 1.51 | ||||||||||||||||||
* Difference in change from baseline of intervention group versus placebo (or versus celecoxib in study 805-01). Negative effect indicates improvement favoring the active intervention reported in the table.
*** versus celecoxib 200.
Pain: Treatment Effects Relative to Placebo
| 95% CrI | Probability that Treatment Shows Small, Moderate or Large Improvement Relative to Placebo* | |||||
|---|---|---|---|---|---|---|
| Treatment (mg) | ES** | Low | High | Small | Moderate | Large |
| acetaminophen 4000 | -0.09 | -0.25 | 0.08 | 0.08 | 0.00 | 0 |
| nsNSAIDs | ||||||
| naproxen 1000 | -0.39 | -0.53 | -0.26 | >0.99 | 0.06 | 0.00 |
| ibuprofen 2400 | -0.41 | -0.63 | -0.18 | 0.96 | 0.20 | 0.00 |
| diclofenac 150 | -0.49 | -0.67 | -0.31 | >0.99 | 0.47 | 0.00 |
| COX-2 selective NSAIDs | ||||||
| celecoxib 100 | -0.11 | -0.31 | 0.10 | 0.18 | 0.00 | 0.00 |
| celecoxib 200 | -0.34 | -0.41 | -0.27 | >0.99 | 0.00 | 0.00 |
| celecoxib 400 | -0.27 | -0.45 | -0.10 | 0.81 | 0.01 | 0.00 |
| lumiracoxib 100 | -0.30 | -0.46 | -0.14 | 0.89 | 0.01 | 0.00 |
| lumiracoxib 200 | -0.27 | -0.44 | -0.10 | 0.80 | 0.00 | 0.00 |
| lumiracoxib 400 | -0.29 | -0.46 | -0.13 | 0.87 | 0.01 | 0.00 |
| etoricoxib 30 | -0.66 | -0.83 | -0.49 | >0.99 | 0.97 | 0.05 |
| etoricoxib 60 | -0.62 | -0.78 | -0.45 | >0.99 | 0.92 | 0.02 |
* Small (ES ≥ 0.2), moderate (ES ≥ 0.5) or large (ES ≥ 0.8).
** Negative effect sizes indicate improvement.
Pain: Treatment Effects of Etoricoxib (30 mg) Relative to Comparators
| 95% CrI | Probability that Etoricoxib 30 mg Shows Small, Moderate or Large Improvement Relative to Comparator* | |||||
|---|---|---|---|---|---|---|
| Comparator (mg) | ES** | Low | High | Small | Moderate | Large |
| acetaminophen 4000 | -0.57 | -0.80 | -0.34 | 1.00 | 0.73 | 0.03 |
| nsNSAIDs | ||||||
| naproxen 1000 | -0.27 | -0.48 | -0.05 | 0.73 | 0.02 | 0.00 |
| ibuprofen 2400 | -0.25 | -0.53 | 0.03 | 0.65 | 0.04 | 0.00 |
| diclofenac 150 | -0.17 | -0.41 | 0.08 | 0.39 | 0.00 | 0.00 |
| COX-2 selective NSAIDs | ||||||
| celecoxib 100 | -0.55 | -0.81 | -0.29 | 0.99 | 0.65 | 0.03 |
| celecoxib 200 | -0.32 | -0.50 | -0.14 | 0.91 | 0.02 | 0.00 |
| celecoxib 400 | -0.39 | -0.62 | -0.15 | 0.94 | 0.17 | 0.00 |
| lumiracoxib 100 | -0.36 | -0.59 | -0.12 | 0.91 | 0.11 | 0.00 |
| lumiracoxib 200 | -0.39 | -0.62 | -0.15 | 0.94 | 0.17 | 0.00 |
| lumiracoxib 400 | -0.36 | -0.60 | -0.13 | 0.92 | 0.13 | 0.00 |
* Small (ES ≥ 0.2), moderate (ES ≥ 0.5) or large (ES ≥ 0.8).
** Negative effect sizes indicate improvement.
Physical Function: Treatment Effects Relative to Placebo
| 95% CrI | Probability that Treatment Shows Small, Moderate or Large Improvement Relative to Placebo* | |||||
|---|---|---|---|---|---|---|
| Treatment (mg) | ES** | Low | High | Small | Moderate | Large |
| acetaminophen 4000 | -0.04 | -0.20 | 0.13 | 0.03 | 0 | 0 |
| nsNSAIDs | ||||||
| naproxen 1000 | -0.37 | -0.51 | -0.23 | 0.99 | 0.04 | 0.00 |
| ibuprofen 2400 | -0.41 | -0.64 | -0.18 | 0.96 | 0.22 | 0.00 |
| diclofenac 150 | -0.52 | -0.70 | -0.33 | >0.99 | 0.58 | 0.00 |
| COX-2 selective NSAIDs | ||||||
| celecoxib 100 | -0.15 | -0.35 | 0.06 | 0.30 | 0.00 | 0.00 |
| celecoxib 200 | -0.34 | -0.42 | -0.27 | >0.99 | 0.00 | 0.00 |
| celecoxib 400 | -0.26 | -0.43 | -0.09 | 0.74 | 0.00 | 0.00 |
| lumiracoxib 100 | -0.32 | -0.48 | -0.15 | 0.92 | 0.02 | 0.00 |
| lumiracoxib 200 | -0.35 | -0.52 | -0.17 | 0.95 | 0.04 | 0.00 |
| lumiracoxib 400 | -0.36 | -0.53 | -0.20 | 0.97 | 0.05 | 0.00 |
| etoricoxib 30 | -0.61 | -0.76 | -0.46 | >0.99 | 0.93 | 0.01 |
| etoricoxib 60 | -0.64 | -0.83 | -0.46 | >0.99 | 0.93 | 0.05 |
* Small (ES ≥ 0.2), moderate (ES ≥ 0.5) or large (ES ≥ 0.8).
** Negative effect sizes indicate improvement.
Physical Function: Treatment Effects of Etoricoxib 30 mg Relative to Comparators
| 95% CrI | Probability that Etoricoxib 30 mg Shows Small, Moderate or Large Improvement Relative to Comparator* | |||||
|---|---|---|---|---|---|---|
| Comparator (mg) | ES** | Low | High | Small | Moderate | Large |
| acetaminophen 4000 | -0.57 | -0.79 | -0.35 | 1.00 | 0.74 | 0.02 |
| nsNSAIDs | ||||||
| naproxen 1000 | -0.24 | -0.45 | -0.04 | 0.66 | 0.01 | 0.00 |
| ibuprofen 2400 | -0.20 | -0.47 | 0.07 | 0.50 | 0.02 | 0.00 |
| diclofenac 150 | -0.09 | -0.33 | 0.14 | 0.18 | 0.00 | 0.00 |
| COX-2 selective NSAIDs | ||||||
| celecoxib 100 | -0.46 | -0.72 | -0.21 | 0.98 | 0.39 | 0.01 |
| celecoxib 200 | -0.27 | -0.43 | -0.10 | 0.79 | 0.00 | 0.00 |
| celecoxib 400 | -0.35 | -0.58 | -0.13 | 0.91 | 0.10 | 0.00 |
| lumiracoxib 100 | -0.29 | -0.52 | -0.07 | 0.80 | 0.03 | 0.00 |
| lumiracoxib 200 | -0.26 | -0.49 | -0.04 | 0.71 | 0.02 | 0.00 |
| lumiracoxib 400 | -0.25 | -0.47 | -0.02 | 0.66 | 0.01 | 0.00 |
* Small (ES ≥ 0.2), moderate (ES ≥ 0.5) or large (ES ≥ 0.8).
** Negative effect sizes indicate improvement.
PGADS: Treatment Effects Relative to Placebo
| 95% CrI | Probability that Treatment Shows Clinical Improvement Over Placebo (≥ 10 mm VAS) | |||
|---|---|---|---|---|
| Comparator (mg) | Difference in CFB* | Low | High | |
| nsNSAIDs | ||||
| naproxen 1000 | -12.9 | -17.7 | -8.2 | 0.89 |
| ibuprofen 2400 | -9.0 | -13.1 | -5.0 | 0.31 |
| diclofenac 150 | -16.2 | -20.6 | -11.7 | >0.99 |
| COX-2 selective NSAIDs | ||||
| celecoxib 200 | -14.7 | -17.3 | -12.1 | >0.99 |
| lumiracoxib 100 | -11.9 | -19.6 | -4.3 | 0.68 |
| lumiracoxib 200 | -11.8 | -19.6 | -4.2 | 0.66 |
| lumiracoxib 400 | -13.9 | -21.5 | -6.1 | 0.85 |
| etoricoxib 30 | -14.2 | -16.8 | -11.6 | >0.99 |
| etoricoxib 60 | -16.2 | -19.8 | -12.7 | >0.99 |
* Negative effect sizes indicate improvement.
PGADS: Treatment Effects of Etoricoxib 30 mg Relative to Comparators
| 95% CrI | Probability that Etoricoxib 30 mg Shows Clinical Improvement Relative to Comparator (≥ 10 mm VAS) | |||
|---|---|---|---|---|
| Comparator (mg) | Difference in CFB* | Low | High | |
| nsNSAIDs | ||||
| naproxen 1000 | -1.3 | -6.8 | 4.1 | 0.00 |
| ibuprofen 2400 | -5.2 | -10.0 | -0.4 | 0.03 |
| diclofenac 150 | 2.0 | -3.2 | 7.1 | 0.00 |
| COX-2 selective NSAIDs | ||||
| celecoxib 200 | 0.5 | -3.2 | 4.2 | 0.00 |
| lumiracoxib 100 | -2.3 | -10.2 | 6.1 | 0.03 |
| lumiracoxib 200 | -2.5 | -10.4 | 5.9 | 0.03 |
| lumiracoxib 400 | -0.3 | -8.5 | 7.6 | 0.01 |
* Negative effect sizes indicate improvement.
MTC Results
Pain
All interventions, with the exception of acetaminophen and celecoxib 100 mg, were more efficacious than placebo (the 95% CrI of the efficacy estimates excluded zero difference) (Table 5a). Naproxen 1000mg, ibuprofen 2400mg, diclofenac 150mg and celecoxib 200mg resulted in at least small improvements (>90% probability of ES ≥ 0.2) over placebo. Etoricoxib 30mg and 60mg demonstrated at least moderate clinical improvements over placebo (>90% probability of ES ≥ 0.5). There is a 96% probability that etoricoxib (30 or 60mg) shows the greatest improvement in pain of all interventions compared (Fig. 1).
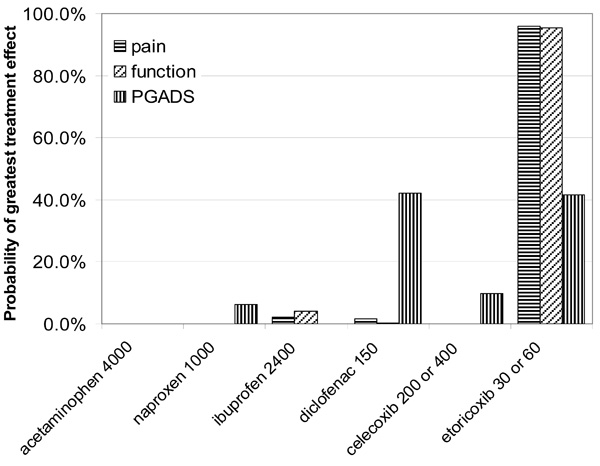
Probability that each treatment provides the greatest improvements in pain, physical function and PGADS.
The improvements in pain with etoricoxib 30mg relative to other interventions ranged from ES=0.17 (diclofenac 150) to ES=0.57 (acetaminophen 4000) (Table 5b). Etoricoxib 30mg is highly likely (>90% probability) to show at least small clinical improvements in pain over acetaminophen, celecoxib, and lumiracoxib.
Physical Function
In terms of physical function, naproxen 1000mg, ibuprofen 2400mg, diclofenac 150mg, celecoxib 200mg, and lumiracoxib all offered at least small improvements (ES ≥ 0.2) over placebo (Table 6a). Etoricoxib demonstrated at least moderate clinical improvements over placebo (>90% probability of ES ≥ 0.5). There is a 95% probability that etoricoxib showed the greatest improvement in physical function of all interventions compared. The ESs of etoricoxib relative to other interventions ranged from 0.09 (diclofenac) to 0.57 (acetaminophen) (Table 6b).
PGADS
All interventions showed improvement in PGADS over placebo (Table 7a). Diclofenac (-16.2), celecoxib 200 (-14.7), etoricoxib 30 (-14.2), and etoricoxib 60 (-16.2) showed the greatest improvements. In Table 7b the differences between and etoricoxib 30 relative to other interventions are presented. There were no clinically relevant differences.
DISCUSSION
The objective of the current study was to synthesize the evidence of acetaminophen, nsNSAIDs (naproxen, diclofenac and ibuprofen) and COX-2 selective NSAIDs (etoricoxib, celecoxib and lumiracoxib) at their recommended dose in the treatment of OA. For pain and physical function both etoricoxib 30mg and 60mg were expected to provide the greatest improvements of all interventions compared. Small clinically relevant benefits can be expected over acetaminophen and the other COX-2 selective NSAIDs. For PGADS etoricoxib 60mg and diclofenac 150mg were expected to show the greatest improvements, but differences versus other interventions were small, let alone clinically relevant. Etoricoxib 30mg demonstrated improvement in PGADS similar to that observed with celecoxib 200mg and lumiracoxib 100mg.
There is often an interest among physicians and decision-makers to identify the most effective treatment among a range of alternatives. Although RCTs provide the best available evidence for the relative treatment effect of a particular pair-wise comparison, RCTs often do not include all available comparator interventions of interest from a clinical decision making perspective. In order to obtain insight in the relative efficacy versus non-included interventions one has to rely on indirect comparisons or mixed treatment comparisons. MTC can be considered a method by which simultaneously multiple meta-analyses of different pair-wise comparisons across a range of different interventions are performed. In general, with MTC the same assumptions apply as with traditional meta-analysis for one type of comparison. Of key importance in both meta-analysis and MTC is not to ‘break randomization’ and only perform analysis with relative effects (8-11). (It is incorrect to simply compare the absolute PGADS improvement observed with etoricoxib in one trial with the absolute improvement observed with a comparator in another study. One reason is that part of the absolute reduction can be attributed to the efficacy of the drug, whereas another part is due to a placebo effect.)
Given the included studies in a MTC, for some comparisons direct (head-to-head) evidence is available, for some comparisons only indirect evidence, and for some possibly both. In the current analysis for example, the relative treatment effect of etoricoxib versus lumiracoxib was obtained through indirect comparisons only. Leung et al., [45] directly compared etoricoxib 60 mg and naproxen 1000 mg, whereas Gottesdiener et al., [44] in combination with Bensen [24], Kivitz [31], and Lisse [38] provided indirect evidence for this comparison through a common placebo arm. It is important that the indirect comparisons are not biased; the indirect comparisons should estimate the same ‘true’ underlying treatment effect as the direct comparisons, otherwise we combine unbiased direct estimates of a treatment effect with biased inidirect estimates of that treatment effect resulting in biased mixed estimates. Although only RCTs are included in the MTC, it is important to realize that the value of randomization does not hold across trials. As a result there is the risk that patients assigned to the different trials are not comparable regarding certain characteristics. If these patient characteristics or baseline risk differences across trials are associated with differences in the treatment effect (i.e. treatment effect modifiers) there can be across study heterogeneity within direct comparisons, biased indirect or mixed comparisons, or both. Differences in study characteristics can also be a source of heterogeneity or bias. To capture heterogeneity a random effects model was used. If there is a bias in the indirect and mixed estimates due to systematic differences in observed effect modifiers across comparisons, this can be explained by means of meta-regression models [11].
In the current analysis, the included studies were similar with regard to patient characteristics which exclude these factors causing bias in the indirect and mixed estimates [10-11]. Accordingly, no meta-regression models were used [11]. However, we have to keep in mind that there is small chance that unknown or unmeasured patient characteristics are different across trials and might cause bias.
Some of the included studies did not explicitly apply the ‘flare’ criterion for inclusion of patients [30,32,35,39]. The flare criterion relates to the fact that following discontinuation (“washout”) of previously used NSAIDs patients demonstrate sufficient disease activity. These trials might have included patients that were less responsive to treatment. Sensitivty analyses excluding these trials provided similar results as the reported findings in this report. Hence, the ‘flare’ criterion seems not a source for bias.
The included studies had treatment durations varying from 2 to 13 weeks. It is known that maximum or near maximum efficacy of NSAIDs is achieved by week 2 and maintained throughout week 12 [44,45]. Hence, these differences in study design cannot be a source of bias. However Lee et al., suggested that trials studying COX-2 selective NSAIDs that were initiated by different sponsors might be different regarding assay sensitivity [49]. This might be an issue for the indirect comparison of etoricoxib versus lumiracoxib.
We consider the performed analysis relevant for clinical decision-making, for several reasons. First, evidence of efficacy is obtained for the all relevant interventions by means of a systematic review of RCTs and the synthesis of evidence is based on current state-of the-art methods. Second, the endpoints considered encompass the full core set of outcomes recommended by OMERACT a world-wide consensus group of experts [12] and the analysis allowed for interpreting the estimated effect sizes regarding their clinical relevance. For pain and physical function effect sizes of 0.2 -0.5, 0.5 -0.8 and >0.8 indicated ‘small’, ‘moderate’ and ‘large’ improvements, respectively [13]. For PGADS a treatment difference of at least 10 mm VAS was assumed to represent a clinical relevant difference [14]. Third, the Bayesian approach of the MTC allowed for probabilistic interpretation of the findings. The estimated size of the treatment effect as well as the associated uncertainty of each intervention was translated into one measure: The probability that a certain treatment out of all treatments compared provided greatest outcomes. This measure leads into a decision-making context. For example, with regard to pain etoricoxib (30 or 60mg) was associated with a 96% probability of providing the greatest improvements. (This corresponds to a probability of 4% of making the wrong decision when etoricoxib is identified as the treatment that results in the greatest improvement in pain.)
CONCLUSION
The current study estimated the treatment effects of acetaminophen nsNSAIDs and COX-2 selective NSAIDs in OA and indicated that etoricoxib is likely to result in the greatest improvements in pain and physical function.
ACKNOWLEDGEMENTS
Declared none.
CONFLICT OF INTEREST
Stephanie Taylor is an employee of Merck & Co., Whitehouse Station NJ, USA. At time of writing, WB Stam and JP Jansen were employees of the Mapi Group. Mapi Group received consultancy fees related to this work from Merck & Co.