All published articles of this journal are available on ScienceDirect.

Knee Pain Examined under Musculoskeletal Ultrasonography: Experience from a Community-based Rheumatology Practice – A Cross-sectional Study
Abstract
Background:
Diagnostic musculoskeletal ultrasonogram (MSUS) in musculoskeletal pain practice has increased. MSUS helps delineate extra-and intra-articular structures that are not visible on X-ray.
Objective:
Explore knee pain under ultrasonogram in a primary care rheumatology (PCR) facility.
Methods:
This cross-sectional study was performed over six months (January 1 and June 30, 2021) to explore knee pain in a community-based PCR setting. A physician registered in musculoskeletal (RMSK) ultrasonogram examined all patients and documented data in a prefabricated questionnaire. Statistical Package for the Social Sciences (SPSS, 28.0.1.1) was used to analyze data. Quantitative and categorical variables were presented with frequency and percentage. The Mann-Whitney-U test assessed the correlation between categorical variables; p<0.05 was considered statistically significant.
Results:
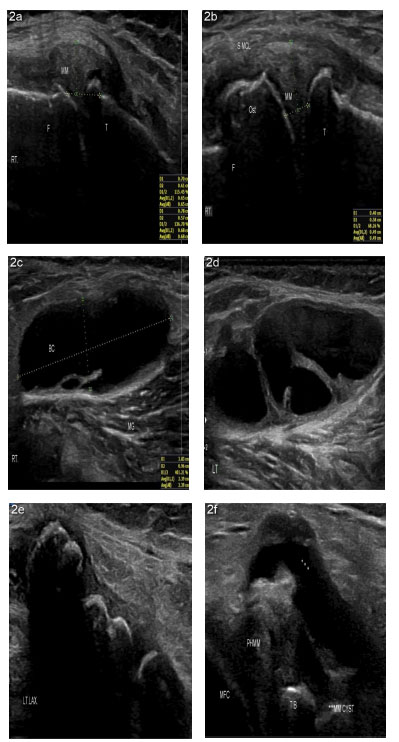
A total of 118 knees of 92 patients were included. Following are MSUS-depicted structural changes: medial joint line osteophytes (91.3%), medial femoral condyle (MFC), cartilage echogenicity (78.3%), synovial plica (76%), knee effusion (61.9%), synovial membrane thickening (54.3%), increased medial collateral ligament (MCL) thickness (42.4), reduced trochlear and MFC thickness (36.9%), Baker's cyst (35.8%), increased MFC thickness (31.5%), medial meniscal extrusion (MME) (27.2%), synovial hypertrophy (20.6%), increased trochlear cartilage thickness (20.6%), MM tear (18.5%), semitendinosus (SMT) bursitis (6.5%), loose body (6.5%), frond-like synovial mass (5.4%), MCL calcification (4.3%) and MM cyst (4.3%). There was a statistically significant correlation between the following variables: Knee effusion and synovial plica; reduced MFC thickness; MME and reduced MFC thickness and moderate osteophyte.
Conclusion:
High-frequency diagnostic ultrasound can depict knee pathology precisely. MSUS at the primary healthcare facility can minimize patient referral and burden over the tertiary setting and reduce overall expenditure.
1. INTRODUCTION
The French physicist Curie brothers discovered the first relevant step to the advanced ultrasound (US) probe [1]. However, the first clinically relevant musculoskeletal ultrasound (MSUS) was published in 1972: American radiologists Daniel McDonald and George Leopold differentiated Baker’s cyst from thrombophlebitis using a B-mode real-time scanner [2]. Peter Cooperberg demonstrated gray-scale (GS) ultrasound synovitis in rheumatoid arthritis (RA) in 1978 [1, 3]. In 1988, the first US description of rheumatoid nodules and tenosynovitis in RA was made [1, 4].
In the early 1980s, the US first described osteoarthritis (OA) [1]. The first US report on cartilage evaluation was published in 1992; however, cartilage smoothness, sharpness, and thickness have been demonstrated since the mid-2000s [1, 6-8]. In 2000, Grobbelaar and Bouffard mentioned the US as an unreliable means for visualizing meniscal pathology [5, 9]. However, De Maeseneer et al. described that MRI had superiority over the US in meniscal tear diagnosis in 1998 [5, 10]. Petersen and Rasmussen further revealed that US-based meniscal tear was as high as in 82% of cases [5, 11]. Synovitis is likely to occur also in OA, similar to RA, with cartilage degeneration [12]. MSUS studies focusing on gout and pseudo-gout started in the mid-2000s. The presence of monosodium urate (MSU) (double contour sign, DCS) and calcium pyrophosphate dehydrate (CPPD) (hyperechoic chondrocalcinosis with the articular cartilage) crystals in aspirated joint fluid is considered the gold standard for gout and pseudo-gout diagnosis, respectively [13-15].
Day-by-day, MSUS has become cheap, portable, and easy-to-use units with small-sized transducers that have made ultrasound accessible in rheumatology practice, including knee disorders. Knee pain chronic problem with adverse impact on daily activities [16]. Knee pain prevalence varies, subject to ethnicity, gender, and other socioeconomic factors [17]. Among various findings, knee effusion is the most common US-depicted feature, followed by meniscal tear, collateral ligament thickening, Baker's cyst, synovial pathologies, etc. [18]. Community-based cohort studies further demonstrated that US-depicted synovial hypertrophy, medial osteophytes, and synovial effusion interacted with increased knee pain risk and predicted early knee OA [19, 20].
The present study describes the MSUS findings of knee pain reported in a community-based healthcare facility in Bangladesh. Performing MSUS at the primary healthcare facility reduces fewer patient referrals to secondary and tertiary hospitals and national healthcare expenditure. We aimed to understand ultrasound-depicted extra-articular (EA) and intra-articular (IA) structural changes in different knee conditions.
2. MATERIALS AND METHODS
A prospective cross-sectional study (without control) with conveniently enrolled patients with knee pain underwent MSUS between January 2021 and June 2021. A Physiatrist with expertise in rheumatology and certified with RMSK (Registry of Musculoskeletal Sonography) (MAB) examined all patients and performed the MSUS [21]. The study was conducted in a primary care facility for pain and rheumatic diseases at Feni (one of the sixty-four districts), Bangladesh, under the approval of the institutional review board of the physical medicine center in Chittagong, Bangladesh; to our best knowledge, the study first-time demonstrates the MSUS findings of knee pain among Bangladeshi. The study was performed according to the Declaration of Helsinki. Patients’ consent was taken.
The data supporting the findings of the article is available in the Zenedo at https://sandbox.zenodo.org/record/1161497#. Y-IyxHZBzIU, reference number [10.5072/zenodo.1161497].
2.1. MSUS Examination of Knee and Terminology used to Define the Structural Changes
Patients lie supine on the examination table with the knee flexed at 20-30 degrees [22]. The anterior, medial, lateral, and posterior knee was examined on the short and longitudinal axis using a high-frequency linear probe (Samsung Accuvix 2010, Probe 12A, South Korea). Smooth probe gliding without any risk of slippage using the 'afternoon tea' technique was followed [23].
Echogenicity: The echogenicity of the tissue refers to the ability to reflect or transmit US waves in the context of surrounding tissues [23, 24]. Anechoic means no transmission of waves, for example, in cartilage, bone, and fluid-filled structures (Baker's cyst, BC, vessels). Fat is almost anechoic, while the fascia and other connective tissue strands and fascicles appear as hyperechoic lines [24]. Muscles are hypoechoic with striate structures. Proximal nerves are hypo-anechoic, and the distal nerves are hyperechoic, with a stippled (“honeycomb”) structure (with hypo-anechoic fascicles on the hyperechoic background of connective tissue surrounding them). Ligaments and tendons are hyperechoic with a fibrillar pattern but not a “honeycomb” like a nerve [24, 25]. Acoustic shadow typically arises from deep to strong hyperechoic reflectors, for example, cortical bone, larger foreign bodies, and calcifications with posterior acoustic shadowing. Enhanced through transmission deep to a fluid-filled structure occurs due to weak sound wave attenuation within a simple fluid (for example, Baker's cyst), resulting in a localized area of increased echo posteriorly to the interface (posterior acoustic enhancement) [26].
Anisotropy and how to improve it?: The anisotropic artifact refers to a darkening and loss of resolution of the image, which occurs when the approach of the sound wave is less than perpendicular (i.e., angle of incidence greater than 0 degrees) [24]. At the insertion of tendon and ligament attachments or course of the tendon, the structures are usually anisotropic; however, changing the angle of incidence with toggling, heel-toe effects of the probe can improve the anisotropy [24, 26].
Doppler activity (DA): Color Doppler (CD) distinguishes blood moving within vessels. When the angle of incidence is close to 90°C, and the flow is low, there will be no color on the screen, producing a false negative indication of no flow; in a situation like in small flow, power Doppler (PD) is more sensitive [24, 25]. Increased DA within the lesion helps differentiate inflammatory from non-inflammatory and monitor treatment outcomes with anti-inflammatory [26].
Anechoic compressible versus non-compressible pathology: joint effusion is usually anechoic and compressible and is found in the distended bursa, knee joint recess, and can be successfully differentiated from non-compressible anechoic structure, for example, ganglion cyst and articular cartilage [27, 28]. Veins are more compressible than an artery with a Doppler effect [29].
Knee regions scanned: Anteriorly, the quadricep's tendon (QT), supra-patellar recess, pre-femoral fat pads, patella, patellar tendon, pre-patellar bursa, infra-patellar bursa, and patellar retinacula were examined for any loss of tendon integrity, alteration of thickness, effusion in the bursa and recess, loose body in the cavity, synovial thickening, hypertrophy, and synovial plica [30, 31]. In full knee flexion, femoral trochlea and medial femoral condylar cartilage smoothness, echogenicity, and thickness are best reviewed [22].
The distal iliotibial band, lateral collateral ligament (LCL), popliteal tendon, common peroneal nerve (CPN), fibular head, and meniscus were laterally scanned. Medial scanning revealed medial collateral ligament (MCL), pes anserinus tendons bursa, and medial meniscus pathology. Valgus and varus stresses were helpful in examining the integrity and laxity of LCL and MCL, respectively [22].
Posteriorly, the patient was examined in a prone position and the knee extended to access the dynamic fat-filled popliteal fossa. First, sartorius, gracilis, and semitendinosus (SMT) were scanned medially. Then, assess whether the semimembranosus gastrocnemius bursa and Baker's cyst (BC) arise between the medial gastrocnemius muscle and SMT tendons. At SMT insertion, the anechoic, compressible collection was checked around the tendon. Postero-laterally, the biceps femoris was checked at insertion into the fibular head; and CPN compressing around the fibular neck was checked [22].
2.2. Outcome Measures
There were two types of outcome measures documented in the study: IA and EA pathologies [1, 22, 30-43].
Intra-articular (IA): The anterior joint recess usually collects uncomplicated anechoic compressible synovial effusions. The anechoic, compressible simple collection is also seen in BC. Sometimes, complicated and heterogenous effusion is seen in infection and post-traumatic hemorrhagic arthropathy [33, 34]. Mobile or impacted loose bodies can also be found in the anterior and posterior joint recesses and BC [33, 35].
In inflammatory arthritis (InA), hypoechoic and thickened synovial membranes with high DA due to hyperemia can be seen in the anterior joint recess and BC [36]. Frond-like synovial mass is characteristic of lipoma arborescence [35]. Anterior knee pain may be associated with synovial plica [30, 36].
Articular cartilage is usually smooth, non-compressible, and anechoic [37]. In early KOA, CPPD crystals depositing within the cartilage make it hyperechoic [37]; however, advanced KOA includes reduced articular cartilage thickness (<2.2 mm) [37]. Podlipská et al. describe the MSUS-based qualitative grading for cartilage regeneration in knee OA: grade-0, normal (smooth, non-compressible, anechoic cartilage); grade I (increased echogenicity of articular cartilage); grade IIa (grade-I plus reduced cartilage thickness < 50%); grade-IIb (grade-IIa plus reduced cartilage thickness > 50%); Grade-III (grade-IIb plus reduced cartilage thickness 100%) [37]. Depositing MSU crystals over the articular cartilage forms DCS, diagnostic for gout [1]; however, DCS may confuse the cartilage interface signs. Hyperechoic DCS, chondrocalcinosis, and subchondral bone creating a ‘triple contour sign’ may be revealed in the OA knee [38].
Medial meniscal (MM) tear is common in clinical practice, and patients report medial knee pain with a history of preceding knee injury. In the MM tear, the explicit hypoechoic cleft is seen. Sometimes, MM tear may be complicated with an anechoic, compressible cyst, and hyperechoic calcification [39]. When MM protrudes two mm beyond the joint line, it is called MME and is significantly associated with knee pain in OA [40].
Extra-articular (EA): Fluid-filled anechoic cystic lesions with or without increased wall DA are seen before the patella (prepatellar bursitis) and before and after the patellar tendon (superficial and deep infra-patellar bursitis) [41]. SMT bursitis signifies anechoic, compressible collection around the fibrillar SMT tendon [42]. Superimposed infection may complicate bursal collection [41]. Osgood-Schallater disease (OSD) and Sinding Larsen Johansen syndrome (SLJS) are seen in children [32]; however, describing them is beyond the scope of the paper. MCL injury is associated with MM tear and anterior cruciate ligament (ACL) injury, an ‘unhappy sign’ [42, 43].
2.3. Statistics
A prefabricated data sheet was used to document clinical and US data. Numerical data were presented with frequency, mean, and standard deviation (SD), and categorical data were reported in frequency and percentage. As the questionnaire included information on categorical variables and the data were not distributed normally, the Mann-Whitney test was used to assess the correlation between independent categorical variables. Statistical Package for the Social Sciences (SPSS, v.28.0.1.1) was used for data analysis. Tables 1-5 and Fig. (1a-f and 2a-f) are used to present data. SPSS was set to mark missing values with a roman number in the list. There was a number everywhere in the listing with a blank in the data.
| Parameters | Frequency | Percentage |
| Age | 1 | 1.1 |
| 21-30 | 4 | 4.3 |
| 31-40 | 17 | 18.5 |
| 41-50 | 31 | 33.7 |
| 51-60 | 28 | 30.4 |
| Over 60 | 31 | 33.7 |
| Sex | 51 | 55.4 |
| Male | 35 | 38.0 |
| Female | 31 | 33.7 |
| Knee pain* | 26 | 28.3 |
| Right | 1 | 1.1 |
| Left | 4 | 4.3 |
| Both | 17 | 18.5 |
| Clinical diagnosis | ||
| Osteoarthritis (OA) of knee | 82 | |
| Anterior knee pain syndrome | 07 | |
| Inflammatory arthritis** | 04 | |
| MCL strain | 04 | |
| Anserine bursitis | 02 | |
| Synovial chondromatosis with OA knee | 02 |
| Parameters | Frequency | Percent | Valid Percent | Cumulative Percent |
|---|---|---|---|---|
| Increased MFC echogenicity | 77 | 83.7 | 87.5 | 87.5 |
| Increased trochlear cartilage echogenicity | 72 | 78.3 | 81.8 | 81.8 |
| Synovial plica | 70 | 76.1 | 76.1 | 76.1 |
| Anterior recess effusion | 57 | 62.0 | 62.0 | 62.0 |
| SM thickening | 50 | 54.3 | 54.3 | 54.3 |
| MCL increased thickness | 39 | 42.4 | 47.0 | 47.0 |
| Reduced trochlear and MFC thickness Grade-iia Grade-iib Grade-iii |
34 25 08 01 |
27.2 8.7 1.1 |
28.4 9.1 1.1 |
28.4 9.1 1.1 |
| BC* | 33 | 35.9 | 38.4 | 38.4 |
| Increased MFC thickness | 29 | 31.5 | 32.6 | 32.6 |
| Reduced MFC thickness | 25 | 27.2 | 28.4 | 28.4 |
| MME | 25 | 27.2 | 27.2 | 27.2 |
| SH | 19 | 20.7 | 20.7 | 20.7 |
| Increased trochlear cartilage thickness | 19 | 20.7 | 21.3 | 21.3 |
| MM tear | 17 | 18.5 | 18.5 | 18.5 |
| Loose body** | 06 | 6.5 | 6.6 | 6.6 |
| SMT bursitis | 06 | 6.5 | 7.2 | 7.2 |
| Frond-like mass | 05 | 5.4 | 5.4 | 5.4 |
| MCL calcification | 04 | 4.3 | 4.8 | 4.8 |
| MM cyst | 04 | 4.3 | 4.8 | 4.8 |
| MM calcification | 02 | 2.2 | 2.4 | 2.4 |
| Anserine bursitis | 02 | 2.2 | 2.4 | 2.4 |
| DCS | 01 | 1.1 | 1.1 | 1.1 |
| Parameters | US-depicted Anterior Recess Effusion |
|---|---|
| Mann-Whitney U | 557.000 |
| Wilcoxon W | 3042.000 |
| Za | -2.318 |
| Asymp. Sig. (2-tailed) | .020 |
| Mann-Whitney U | 396.000 |
| Wilcoxon W | 3399.000 |
| Zb | -.409. |
| Asymp. Sig. (2-tailed) | .682 |
| Mann-Whitney U | 702.000 |
| Wilcoxon W | 1027.000 |
| Zc | -.933 |
| Asymp. Sig (2-tailed) | .351 |
| Mann- Whitney U | 829.500 |
| Wilcoxon W | 1390.500 |
| Zd | -.472 |
| Asymp. Sig (2-tailed) | .637 |
| Mann-Whitney U | 1037.000 |
| Wilcoxon W | 1983.000 |
| Ze | -.154 |
| Asymp. Sig. (2-tailed) | .878 |
| Mann-Whitney U | 823.000 |
| Wilcoxon W | 2839.000 |
| Zf | -.904 |
| Asymp. Sig. (2-tailed) | .366 |
| Mann-Whitney U | 658.500 |
| Wilcoxon W | 2869.500 |
| Zg | -1.767 |
| Asymp. Sig. (2-tailed) | .077 |
| Mann-Whitney U | 554.000 |
| Wilcoxon W | 3329.000 |
| Zh | -.911 |
| Asymp. Sig. (2-tailed) | .362 |
| Parameters | Reduced MFC Thickness | |
|---|---|---|
| Mann-Whitney U | 609.000 | |
| Wilcoxon W | 934.000 | |
| Za | -1.986 | |
| Asymp. Sig. (2-tailed) | .047 | |
| Mann-Whitney U | 785.000 | |
| Wilcoxon W | 2381.000 | |
| Zb | -.938 | |
| Asymp. Sig (2-tailed) | .348 | |
| Mann-Whitney U | 661.000 | |
| Wilcoxon W | 2939.000 | |
| Zc | -.533 | |
| Asymp. Sig. (2-tailed) | .594 | |
| Mann-Whitney U | 914.000 | |
| Wilcoxon W | 1949.000 | |
| Zd | -.572 | |
| Asymp. Sig. (2-tailed) | .568 | |
| Mann-Whitney U | 662.000 | |
| Wilcoxon W | 1068.000 | |
| Ze | -2.041 | |
| Asymp. Sig. (2-tailed) | .041 | |
| Mann-Whitney U | 248.000 | |
| Wilcoxon W | 293.000 | |
| Zf | -1.895 | |
| Asymp. Sig. (2-tailed) | .058 | |
| Mann-Whitney U | 420.000 | |
| Wilcoxon W | 556.000 | |
| Zg | -2.069 | |
| Asymp. Sig. (2-tailed) | 0.039 | |
| Parameters | US-depicted Baker's Cyst |
|---|---|
| Mann-Whitney U | 599.000 |
| Wilcoxon W | 830.000 |
| Za | -.996 |
| Asymp. Sig. (2-tailed) | .319 |
| Mann-Whitney U | 625.000 |
| Wilcoxon W | 901.000 |
| Zb | -1.031 |
| Asymp. Sig (2-tailed) | .302 |
| Mann-Whitney U | 698.500 |
| Wilcoxon W | 974.500 |
| Zc | -.171 |
| Asymp. Sig. (2-tailed) | .864 |
| Mann- Whitney U | 342.500 |
| Wilcoxon W | 3192.500 |
| Zd | -.528 |
| Asymp.Sig. (2-tailed) | .597 |
| Mann-Whitney U | 735.000 |
| Wilcoxon W | 1515.000 |
| Ze | -1.331 |
| Asymp. Sig. (2-tailed) | .183 |
| Mann-Whitney U | 848.000 |
| Wilcoxon W | 1883.000 |
| Zf | -.765 |
| Asymp. Sig. (2-tailed) | .444 |
| Mann-Whitney U | 518.500 |
| Wilcoxon W | 654.500 |
| Zg | -.446 |
| Asymp. Sig. (2-tailed) | .655 |
3. RESULTS
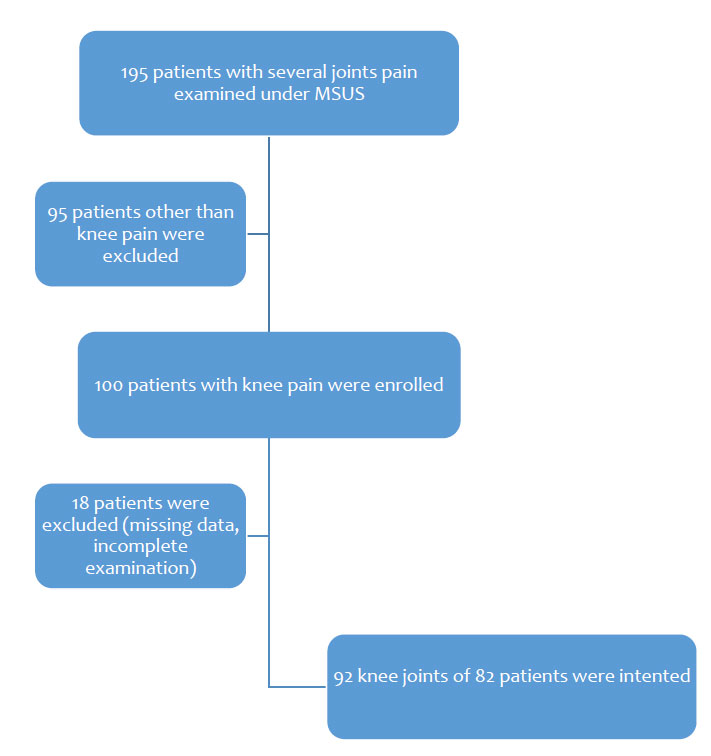
A total of 195 patients with knee, shoulder, wrist/hand, ankle/foot, elbow, and hip/thigh pain was scanned; among them, 100 patients were examined for knee complaints, a period prevalence [44] of 51.28%. Eighteen out of 100 knee sufferers were excluded from the study because of missing some critical information. Finally, 92 knee joints in 82 patients were analysed: 31 were male, 51 were female. Over 60% of patients were aged over 50. Before the MSUS, around 90% had the clinical diagnosis of KOA depending on clinical and radiological (Kellgren-Lawrence score) features.
Only four patients had the InA. Table 1 depicts the demography of the study participants (Fig. 3).

Among the study participants, OA was the most common clinical diagnosis. Nonspecific, anterior knee pain was the second most common diagnosis. Only four patients had inflammatory arthritis (3 RA, 1 SpA). Clinical diagnosis of posttraumatic MCL strain, anserine bursitis, and synovial chondromatosis or loose body in the anterior joint recess of OA knee was made in 4, 2, and 2 patients (Table 1).
Table 2 demonstrates US findings in chronology. Osteophytes were seen in the medial joint lines seen in 84 patients, and the maximum (43) had mild osteophytes; only ten patients had severe grade osteophytes. Increased cartilage thickness and echogenicity are expected in early OA: trochlear and medial femoral condyle cartilage echogenicity increased in 72 and 77 patients, respectively; increased MFC and trochlear cartilage thickness was shown in 29 and 19 patients, respectively. Reduced MFC cartilage thickness was revealed in 34 cases - 25 had grade iia cartilage thickness, eight patients had grade iib, and only one had severe grade iii cartilage degeneration.
Anterior joint effusion with the anechoic compressible collection was seen in 57 patients. Anterior knee effusion is also seen with increased SM thickness, medial collateral ligament (MCL) thickness, medial meniscal extrusion (MME), and synovial hypertrophy (SH) in 50, 39, 25, and 19 cases. Among BC, increased Doppler activity was seen in 13 patients, and nine patients had septate BC. An explicit anechoic cleft was seen within the medial meniscus in 19 patients. MCL calcification, MM cyst, MM calcification, and double contour sign were seen in 4, 4, 2, and 1 cases.
Antero-medially an enlarged anserine bursa was seen at the insertion of semitendinous, gracillis and sartorius tendons at the proximal and upper medial tibia in 2 patients. In 33 cases, Baker's cyst with the anechoic compressible collection has been revealed; among them, in 13 cases, there was increased Doppler activity, and in nine instances, BC was septate. Besides the anterior joint recess, the loose body has been impacted in the synovial tissue posteriorly. SMT tendon bursitis and impacted loose body were depicted in 6 patients each.
The correlation between anterior joint recess effusion and synovial plica was statistically significant (p<0.05) but not with increased MFC echogenicity, reduced MFC thickness, US-depicted Baker's cyst, mild medial joint line osteophyte, and moderate joint line (Table 3). Besides, reduced MFC thickness was correlated with only MME, although not with clinical synovial effusion, synovial plica, and medial joint line osteophyte (mild - severe) (Table 4). On the other hand, US-depicted BC was not correlated with synovial plica, MME, reduced MFC thickness, increased MFC echogenicity, increased MCL, and SM thickness (Table 5).
4. DISCUSSION
Knee pain with various clinical causes was examined with MSUS to define IA and EA structural changes [33-40, 42, 43, 45]. In an original work with different ethnic Malaysian people, Chia et al. reported the highest knee pain prevalence in Indian ethnic Malaysians, especially in women, than other ethnic groups [17]. In another community-based cohort study, Jiang et al. evaluated chronic knee pain with MSUS and documented the highest prevalence of synovial effusion, followed by synovial hypertrophy; increased synovial abnormalities were seen associated with increased knee pain [19]. The associations between synovial hypertrophy and effusion with knee pain were more pronounced with radiographic knee OA. In another community-based research, Saito et al. reported that MSUS-depicted medial meniscus extrusion and osteophytes showed significant associations with knee symptom scores than radiological KL scores [20]. In the present study, we see knee pain is more in women; as the age increased, the number of knee sufferers also increased. The highest number of patients had a known diagnosis of knee OA. Here we describe MSUS-delineated structural changes in the study participants.
4.1. Reduced Cartilage Thickness, Osteophyte Formation, and Effusion in OA
In the present study, we depicted articular cartilage increased echogenicity and thickness, reduced cartilage thickness, MME, osteophyte formation, and synovial effusion in KOA. Podlipska et al. documented US-depicted IA structural changes in KOA, and the most common pathologies were reduced cartilage thickness, osteophyte formation, and MME [37]; global femoral cartilage degeneration grade was strongly associated with pain, and the Western Ontario and McMaster Universities Osteoarthritis Index (WOMAC) index [37]. The presence of lateral femoral osteophytes (irrespective of size) was also associated with increased pain and WOMAC index. All osteophyte grades in the MFC were associated with worsened WOMAC clinical symptoms [37].
The ZAGAZIG, US scale constitutes a validated tool of five domains [46]: severity of KOA (depending on the osteophyte severity grade, 0-4), effusion (0-3), grey-scale synovitis (0-3), pes anserine tendonitis/bursitis (0-2), and BC (0-2) [46]. A recent cross-sectional observational study that included 245 KOA was assessed with the ZAGAZIG-US tool, and positive correlations were depicted between the ZAGAZIG score and WOMAC subscales (pain, stiffness, and function) [46]. The ZAGAZIG scale and VAS pain and Health Assessment Questionnaire-II (HAQ-II) had strong positive correlations [46]. The total US score can distinguish between mild and moderate-severe KOA [46-48]. Another study with KOA depicted a strong correlation between the radiographic medial tibiofemoral (TFJ) narrowing and the US-MFC grade (p< 0.0001) [49]; radiographic and US-femoral osteophyte (medial and lateral) (p< 0.0001) [49]. The US could delineate osteophytes in EOA where X-ray was negative for osteophytes [49, 50]. The correlation of cartilage thickness severity between US and arthroscopy varied from insignificant to significant depending on the site involved: at the sulcus - the correlation was highest (p<0.001); at MFC was notable (p=0.003); at LFC, no significant correlation (p=0.103) [51].
In another study, Basha et al. reported US and MRI findings in anterior knee pain (AKP); joint effusion was the most common (38%), followed by trochlear cartilage defect (20.6%) and superficial infrapatellar subcutaneous edema (20%) [52]. Draghi et al. demonstrated the US's sensitivity and specificity of 81.3% and 100% specificity in knee effusion [41]. The US could approximate as low as 7 to 10 ml joint effusion [53]. US is a suitable alternative to MRI in AKP [52].
Mild-moderate radiographic KOA was examined under the dynamic US using a standardized OMERACT scanning protocol and assessed clinical severity (numerical rating scale for pain and Knee Injury, Osteoarthritis Outcome Score (KOOS), radiographic OA severity (KL score), and MRI Osteoarthritis Knee Score (MOAKS) of US pathologies [54]. All US scores (except for cartilage grade) demonstrated significant associations with worse KOOS symptoms, whereas only PD and meniscal extrusion were associated with worse KOOS pain [54]. US pathologies revealed a moderately good correlation with their MOAKS counterparts. Articular cartilage calcification is seen with advanced age [55]. There is a positive correlation between cartilage calcification and grade 1 and 2 but not above 2 OA grades [55]. In the present study, reduced MFC cartilage thickness in the KOA was significantly associated with MME but not with clinical effusion, osteophyte size, or MM tear.
4.2. Synovial Membrane Increased Thickness, Increased Doppler Activity in Inflammatory Arthritis
High-resolution MSUS has been increasingly used in inflammatory arthritis in RA [56]. MSUS delineates synovitis and bone erosion, which correlate with clinical disease activity in RA [56]. A longitudinal pilot study explored synovitis in reactive arthritis (ReA) with MRI and US [57]. In an interesting study, 25 first-degree relatives (FDRs) of RA without clinical arthritis and negative for RF and ACPA were examined under MSUS, which depicted inflammatory synovial changes in 40% of cases [58]. Another large cohort study investigated 273 FDRs: 8% were positive for anti-CCP, 21% had unclassified arthritis (UA), and 35% had MSUS-depicted active synovitis [59]. US use in FDRs without clinical RA was not impressive, except in those with UA [59]. In a multicenter study, PD signal and morning stiffness (over thirty minutes) at baseline were independently associated with incident InA in clinically suspected arthralgia [60].
US and MRI are comparable regarding synovitis and tenosynovitis diagnosis [61]. US can predict synovial inflammation in preclinical RA with at-risk populations [62]. US-depicted joint synovial thickening, bone erosion, tendon sheath synovial thickening, tendon sheath, bone, and enthesis PD signal, and bone erosion were higher in PsA than in non-PsA patients (p<0.05) [63].
US is comparable to dual-energy CT (DECT) in gout involving the knee, as revealed in a prospective study [64]. DCS was considered the most valuable US sign in gout [64]. OMERACT-US could be a helpful tool to monitor urate-lowering therapy (ULT) in gout and monitor the significant change in DCS and tophus sum score at follow-up (p<0.05) [65]. The US also is valuable in CPPD diagnosis [66]. In the present study, we documented only four InA with synovial effusion and increased synovial thickening in the anterior joint recess. BC with high DA was also noted. In one patient with a previous diagnosis of gout, DCS was seen.
4.3. Medial Meniscal Extrusion (MME), MM Tear, Cysts (Meniscal and Para-meniscal), and Calcification
Clinically diagnosed early KOA was explored in the US to study MM dynamically [67]. MME > 2 mm can occur in 75% of early medial KOA cases [67]. Clinically suspected MM tears may be correctly diagnosed with US and MRI [68]. The sensitivity, specificity, and positive and negative predictive values of MM tears appeared to be the same for both US and MRI [68]. Regarding MM tear, US and MRI findings were comparable to arthroscopy [68]. Patients negative for US-MM tear should not go for MRI [68].
In an observational study with chronic knee pain, the US showed excellent sensitivity (95% and 96% for each reader) and good specificity (82% and 70% for each reader) in MME diagnosis [69]. US is useful in monitoring cartilage thickness and MME pre-and post-IA interventions, as documented in a study with unilateral KOA [70]. In the present study, we did not quantify the MME and MFC thickness; instead, we confirmed whether MME was present. MM extrusions beyond 2 mm registered as MME; we further measured MFC cartilage thickness in the study participants using the Podlipski technique [37]: out of 34, the maximum 73.5% had the grade IIa degeneration, and only one had a severe decline of articular cartilage thickness. We did not document IA cartilage thickness and MME changes after IA injection, and it was not our study aim.
A lateral meniscal cyst could cause knee pain with snapping [71]. The MRI and US-depicted well-circumscribed cyst can be revealed [71, 72]. Para-meniscal cyst of MM with medial knee pain may cause popliteal artery compression that can be relieved with US-guided aspiration [72]. In the present study, we documented MM cysts and MM calcification in 4.3% and 2.2% of cases of KOA, respectively.
Meniscal calcifications have been revealed in human cadaveric menisci with high-spatial-resolution radiography and 3.0-T MR (ultrashort echo time, UTE-MR) imaging and classified as punctate, linear, or spherical and could be pathognomonic in OA [73], could be meniscal a new target for OA [74]. We noted MCL calcification in all cases with MCL strain.
4.4. Synovial Chondromatosis or Loose Body
Synovial chondromatosis was first described by Leannac in 1813 [74]; however, Jaffe's current description was applied in 1958 [74]. An identical process can also involve the synovium extending along with tendons and bursae and is referred to as tenosynovial and bursal chondromatosis, respectively [74]. Secondary synovial chondromatosis is associated with trauma, osteochondritis dissecans, neuropathic osteoarthropathy, OA, and septic or InA. Primary synovial chondromatosis typically affects the adult knee [74]. In the present study, we found the loose body in six patients, and all were in OA knee: four were found anteriorly, and two were in the knee back.
Clinical symptoms typically include pain, swelling, and restricted joint ROM [74]. Radiographic features include multiple IA chondral bodies with “ring-and-arc” chondroid mineralization and extrinsic erosion of bone on both sides of the joint [74]. Radiology is normal in 5%–30% of cases [73]. Limited case reports described the US features of synovial chondromatosis - heterogeneous mass containing foci of hyperechogenicity with posterior acoustic shadowing being seen in the joint recess, bursa, tendon sheath, and synovium, either impacted or loose with the change of position during dynamic US examination [74]. Arthroscopic treatment is successful with low recurrence rates [75]. We managed synovial chondromatosis with IA steroid and lidocaine injection and referred the patient for an orthopedists' opinion and further action.
4.5. Synovial Plica and Lipoma Arborescence
Synovial plica of the knee is common in clinical practice. Patients usually report intermittent pain, swelling, and snapping sensation affecting the knees, related to increased patella-femoral joint loading [30]. MRI reveals plica as bands of low signal intensity within the high-signal-intensity synovial fluid; however, the medial plica is challenging to see with effusion, an important cause of medial knee pain [76].
In suspected medial plica, dynamic sonography had diagnostic accuracy, sensitivity, and specificity of 88%, 90%, and 83%, respectively [77, 78]. The US is useful in detecting supra-patellar and all medial patellar plicae but not infra-patellar plicae [52]. In the present study, we defined synovial plica in over 70% of patients. The correlation between synovial plica and US-depicted anterior recess effusion was significant (p<0.05).
Lipoma arborescence is a rare, benign IA lesion typically of the knee joint and is primary and secondary to OA, RA, trauma, or diabetes mellitus [35]. Frond-like, pliable, hyperechoic lipoma arborescence can be seen in US in the supra-patellar recess with or without compressible anechoic effusion and increased DA [35, 79]. In the present study, lipoma arborescence was noted in five patients with (four KOA and one SpA); we treated them with IA methyl-prednisolone. We did not examine them on histopathology.
4.6. Baker’s Cyst
A BC is an abnormal fluid distension in the gastrocnemius semimembranosus (G-S) knee bursa [80]. G-S bursa is located in the medial aspect of the popliteal fossa of the knee, at the intersection between the semimembranosus tendon (SMT) and the tendon of the medial head of the gastrocnemius (MHG). BC is found in about 4% to 7% of asymptomatic adults, 38% of patients with internal knee derangements (IKDs), and 22% to 47% with KOA. Like MRI, the US also has a diagnostic value for BC [80].
A BC may have a broad base than the body, neck between the MHG and SMT, and septa within the cyst [81]. BC is further complicated by ruptured walls and the dissemination of their contents around [80, 82]. Giant BC could find in InA [81, 83]. In this study, we documented BC in 33 patients; however, BC was not significantly correlated with anterior recess effusion, synovial plica, reduced cartilage thickness, increased cartilage echogenicity, or increased MCL thickness. We did not find any ruptured cysts. BC was approached with a 20G needle for aspiration, followed by IL methyl-prednisolone and lidocaine injection.
4.7. Bursitis
The serous bursae consist of a synovial membrane enveloping a fluid film [84]. Bursae are native and adventitious - native bursae are lined with a synovial membrane and present at predictable anatomical sites; they are easily distinguished from pathological entities [85]. The adventitious bursa forms at friction sites but with similar US features to native bursae (unilocular, simple, compressible, and anechoeic) [85]. Unlike bursal cysts, ganglion cysts are usually multilocular and non-compressible [85].
A variety of bursae are found around the knee: anteriorly (supra-patellar, pre-patellar, superficial infra-patellar, and deep infra-patellar), medially (pes anserine, medial collateral ligament, and posteriorly (semimembranosus–medial collateral ligament bursae, BC), laterally (lateral compartment Iliotibial and lateral collateral ligament–biceps femoris bursae). Overuse, trauma, infection, bleeding, arthropathy, IKDs, villonodular synovitis, and synovial osteochondromatosis contribute to bursal inflammation [84, 85]. Draghi et al. depicted the diagnostic value of the US as compared to MRI [41]. The diagnostic sensitivity and specificity of US for supra-patellar bursitis are 71.4% and 100%, respectively [41]. Anechoic, compressible, septated bursitis with or without increased DA around the SMT may sometimes be confused with BC [86]. The US accurately delineates the anserine bursa, including its anatomical variations [87]. We documented bursitis in eight patients in the present study: six SMT bursitis and two anserine bursitides. We had no pre-patellar and infra-patellar (superficial and deep) bursitis. We successfully managed all of them with IL methylprednisolone and lidocaine injection.
Study limitation: the study was conducted in a single community-based rheumatology facility with a limited number of cases. Only one physician with expertise in MSUS was involved in the patient examination, so we could not check the inter-observer variability of the diagnosis.
CONCLUSION
Musculoskeletal ultrasonogram has been considered the stethoscope of rheumatologists. A primary care rheumatology practice equipped with a diagnostic ultrasound helps minimize the burden over tertiary healthcare facilities and reduces overall treatment costs. So we need to diagnose knee pain sources at their earliest stage. Ultrasonograms can depict various structural changes with knee pain; however, they may vary in research settings depending on ethnic, cultural, and gender variations. We need more research to learn whether and how ultrasonographic abnormalities in knee pain change in community-based settings; otherwise, we can not generalize this limited information from a limited facility for a whole nation.
LIST OF ABBREVIATIONS
| US | = Ultrasound |
| GS | = Gray-Scale |
| RA | = Rheumatoid Arthritis |
| OA | = Osteoarthritis |
| MSU | = Monosodium Urate |
| EA | = Extra-Articular |
| IA | = Intra-Articular |
| DA | = Doppler Activity |
| CD | = Color Doppler |
| PD | = Power Doppler |
| QT | = Quadricep's Tendon |
| LCL | = Lateral Collateral Ligament |
| MCL | = Medial Collateral Ligament |
| CPN | = Common Peroneal Nerve |
| SMT | = Semitendinosus |
ETHICS APPROVAL AND CONSENT TO PARTICIPATE
The Institutional Review Board (IRB) of Physical Medicine Centre Chittagong, Bangladesh has approved the study and it was performed with patients’ consent.
HUMAN AND ANIMAL RIGHTS
No animals were used for studies that are the basis of this research. The reported experiments on women are in accordance with the Helsinki Declaration of 1975, as revised in 2013 (http://ethics.iit.edu/ecodes/node/3931).
CONSENT FOR PUBLICATION
Informed consent was obtained from all participants.
STANDARDS FOR REPORTING
STROBE guidelines and methodologies were followed.
AVAILABILITY OF DATA AND MATERIALS
The data supporting the findings of the article is available in the Zenedo at https://sandbox.zenodo.org/record/1161497#. Y-IyxHZBzIU.
FUNDING
None.
CONFLICT OF INTEREST
The authors declare no conflict of interest, financial or otherwise.
ACKNOWLEDGEMENTS
Declared none.