All published articles of this journal are available on ScienceDirect.

Detrimental Impact of Interferon-Based Regimens for Chronic Hepatitis C on Vitamin D/Parathyroid Hormone Homeostasis
Authors Info & Affiliations
Abstract
Background:
Both the anti-infective and anti-inflammatory properties of vitamin D, an essential hormone of calcium homeostasis, have ample support in the literature. The high rates of vitamin D deficiency among patients with chronic hepatitis C are also well known. That supplementation with vitamin D may boost sustained viral response rates in vitamin D deficient, hepatitis C virus (HCV) infected patients undergoing Interferon-alpha (IFN) treatment, on the other hand, is controversial. Surprisingly, studies considering in this latter setting what are the effects of IFN treatment (with or without vitamin D supplementation) on the other major regulator of mineral metabolism, i.e. the Parathyroid hormone (PTH), are lacking.
Aim:
Evaluate the impact of interferon-based treatment against HCV (±cholecalciferol supplementation) on vitamin D and PTH homeostasis.
Methods:
A series of 40 consecutive patients received pegylated IFN plus ribavirin to treat chronic hepatitis C. At the discretion of their physician, some of them (N. = 27) received vitamin D supplementation while others did not (N. = 13). All had measured plasma 25-hydroxycholecalciferol and PTH concentrations at baseline, at completion of the 4th (TW4) and 12th treatment week (TW12) and at 24 weeks after the end of therapy (SVR24).
Results:
Plasma PTH concentration increased significantly from baseline during treatment, raising to 44.8 [30.7-57.2] pg/mL at TW4 (p=0.01), 47.0 [37.1-63.2] pg/mL at TW12 (p=0.006) to return to baseline levels in the follow-up (34.5 [27.6-43.0]; p=0.16). The proportion of patients who satisfied criteria for hyperparathyroidism was higher at TW12 (N=10, 25%) than at TW4 (N=6, 15%). There was no statistical correlation between vitamin D and PTH blood levels (ρ=-0.07; p=0.65).
Conclusion:
An increase in plasma PTH occurs systematically during IFN treatment of HCV patients and cannot be prevented by vitamin D supplementation.
1. INTRODUCTION
Chronic hepatitis C is one of the most widespread liver diseases in the world, with over 170 million individuals infected with the hepatitis C virus (HCV) and 3-4 million new cases every year [1, 2]. Before the introduction of the Direct-Acting Antivirals (DAAs) [3], the standard of care consisted of the combination of Pegylated (PEG) Interferon-alfa (IFN) and ribavirin administered for a period of 24 or 48 weeks, depending on HCV genotype [4]. Besides the virus, the efficacy of IFN treatment is influenced by several genetic and metabolic factors [5], one of which may be the vitamin D status of patients.
Vitamin D is a steroid hormone, involved in many biological processes and has a bidirectional relationship with liver, in fact, vitamin D production and activation are closely regulated by the liver [6]. Indeed, there is a high prevalence of vitamin D deficiency in liver diseases, such as alcoholic hepatitis, non-alcoholic fatty liver disease and chronic viral hepatitis [7]. Furthermore, vitamin D deficiency is a negative prognostic factor for patients with HCV genotype 1 infection, correlating with the severity of liver disease and a poorer response to interferon-based therapy, with significantly lower Sustained Virologic Response (SVR) rates [8]. On the other hand, vitamin D supplementation has been shown to complement IFN-based antiviral therapy leading to significant improvements in SVR [9]. Similar improvements in SVR were observed in patients with HCV genotypes 2 and 3 [10]. However, a metanalysis of eleven studies including more than 2,600 patients failed to demonstrate any association between baseline vitamin D levels and SVR [11]. The high efficacy and excellent safety profile of DAAs have made IFN treatment of HCV infection obsolete in many parts of the world, though the pathophysiology of hepatitis C remains linked to activation of the interferon system [12] and other indications for the use of IFN remains, despite its toxicity. For these reasons, dissecting the intricacies of the relationship between IFN and vitamin D is not futile.
The main physiological action of vitamin D is the regulation of calcium/phosphate metabolism and maintenance of bone health; in fact, a defective vitamin D status leads to the development of a secondary hyperparathyroidism, aiming to maintain calcium levels within the range of normality [13]. Therefore, the definition of vitamin D adequacy is historically based upon the identification of the plasma 25(OH) vitamin D threshold able to suppress PTH synthesis. On this basis, the threshold of 75 nmol/L (30 ng/mL) is deemed adequate for bone health [14] and the vitamin D status is defined deficient for concentration lower than 50 nmol/L (20 ng/mL) and insufficient for 50-75 nmol/L (20-30 ng/mL) [13]. However, there is evidence suggesting that the inverse relationship between vitamin D and PTH might be less linear in patients affected by chronic liver disease [15].
In this study, we aimed to evaluate the effect of chronic hepatitis C on vitamin D/PTH axis and whether IFN-based regimens have a predictable an impact on vitamin D homeostasis.
2. PATIENTS AND METHODS
We performed a retrospective study on the entire casuistry of patients referred for antiviral treatment of HCV infection to the Liver Clinic of a University Hospital in Northern Italy, in the period between 1st October 2003 and 1st September 2013. In this study, the necessary inclusion criteria for each patient were as follows: a) chronic HCV infection at the time of entry into the study (documented by HCV positive viraemia) and absence of any previous antiviral therapeutic attempt (so-called naive patients); b) documentation of antiviral treatment with the current standard therapy for HCV (PEG-IFN-alpha and ribavirin) for a minimum duration of at least 12 consecutive weeks, according to the current schedule accepted in the technical data sheet (24 weeks for HCV genotypes 2 and 3, 48 weeks for genotypes 1 and 4): these therapies should be completed for at least 6 months from the date of closure of the study, according to what is commonly expected for the minimum follow-up duration after antiviral treatment; c) availability of complete clinical and biohumoral data both at baseline and at the time points commonly tested during antiviral treatment (in particular 4th (TW4) and 12th (TW12) treatment weeks and 24 weeks after the end of therapy); d) availability of biological samples at all aforementioned time points (whole blood, serum and plasma); e) obtainment of written informed consent from the patient to the use of biological specimens/personal sensitive data. The exclusion criteria, for each patient, were instead: a) lack of informed consent; b) lack of completeness of clinical/biohumoral data or biological samples at the aforementioned time points; c) presence of viral co-infections (hepatitis B or human immunodeficiency viruses) or concomitant liver tumors; chronic intake of vitamin D supplementation at the time of entry into the study for reasons unrelated to antiviral treatment (e.g. renal insufficiency, osteoporosis). The patients initially selected were 209. Using the above criteria, the following patients were excluded from the study: N.=26 because not naive to antiviral treatment; N.=112 as no clinical data and/or complete biological samples were available; N.=8 as treated with protease inhibiting drugs (e.g. boceprevir); N.=5 as treated with non-PEG standard IFN +/- ribavirin; N.=18 because antiviral treatment and/or related follow-up had not yet been completed as of 1st September 2013. Therefore, 40 Caucasian patients (20 F, 20 M) could be included in the study, which was conducted in strict adherence to the principles of the Declaration of Helsinki. More in detail, 12 subjects received PEG-IFN-alpha-2a (at a standard dose of 180 mcg/week), and 28 PEG-IFN-alpha-2b (at a dose of 1.5 µg/kg/week as per data sheet). Moreover, 27 patients received vitamin D supplementation at least four weeks before starting therapy as well as during antiviral treatment (7500 IU/week, preceded by a loading dose of 300000 IU in the 21 subjects with a more severe deficiency); the second group of 13 subjects did not receive any supplementation, as it was treated before 2010, when there was still no scientific evidence of a possible gain in therapeutic response compared to the simple standard antiviral treatment [9]. Before undergoing antiviral treatment, liver disease was staged by performing Transient Elastography (TE), assessing Liver Stiffness (LS), by a FibroScan® device (Echosens, Paris, France). Fibroscan was performed as reported by Sandrin et al. [16], using at least 10 valid measurements; examinations were considered reliable when the interquartile range was <30% and the success rate was >60%. Furthermore, the Fibrosis-4 (FIB-4) was calculated for each patient, as reported by Sterling et al. [17].
A fasting blood sample (EDTA) was drawn before the onset of therapy, at 4 weeks and 12 weeks and after 24 weeks of follow-up. Plasma samples were aliquoted and stored at -80°C for subsequent analysis.
Clinical and laboratory data were collected in an electronic database. The BMI was calculated as body weight divided by the square of the height (kg/m2). The following laboratory data were obtained:
- Serum aspartate aminotransferase (AST), alanine aminotransferase (ALT), calcium* and phosphorus* were measured with the Advia 1800 Chemistry System (Siemens Healthcare, Germany).
-
Plasma 25-hydroxycholecalciferol and PTH concentrations were measured by chemiluminescence using the kits LIASON®25 OH vitamin D TOTAL and LIASON® N-TACT® PTH II (Diasorin, Saluggia, Italy), respectively. Local laboratory normal ranges were 30-100 ng/mL and 14.4-63.3 pg/mL, respectively.
- *available in 10/40 patients
Statistical analysis was carried out using GraphPad Prism software version 6.0 for Mac OS X (GraphPad Software, La Jolla, CA, USA, www.graphpad.com). Data distribution was analyzed with the Shapiro-Wilk test, rejecting the null hypothesis (Gaussian distribution). Accordingly, the measures of centrality and dispersion used throughout the paper to describe continuous variables are medians and Interquartile Ranges [IQR], while categorical variables are shown as frequencies (%). Plasma 25(OH) vitamin D and PTH concentration at different time points were compared by the Wilcoxon test for paired samples. Plasma 25(OH) vitamin D and PTH concentrations between supplemented and non-supplemented patients, and the kinetics of the plasma levels of vitamin D and PTH between responders and non-responders to antiviral treatment were compared by the Mann-Whitney test. We used the Spearman’s correlation to test the association between 25(OH) vitamin D and PTH plasma levels and between the severity of liver fibrosis and 25(OH) vitamin D and PTH levels. The modifications of 25(OH) vitamin D and PTH plasma levels according to different seasons were tested with the Chi-Square test. In order to verify the relationship between selected dichotomous dependent variables (Rapid Virological Response (RVR), SVR) and a set of independent predictive variables, a stepwise logistic regression analysis was conducted with a forward approach.
The threshold value chosen to indicate the statistical significance was 0.05 (two tails) for all the analyses.
3. RESULTS
3.1. 25 (OH) Vitamin D Concentration
In Table 1, we report the main demographic and clinical features of the study population, which were consistent with the characteristics of patients with well-compensated chronic hepatitis C in Italy.
In Fig. (1a) we present the scatterplot of plasma vitamin D concentrations at baseline; 27/40 (67.5%) patients had an inadequate vitamin D status, 6/40 (15%) having vitamin D insufficiency and 21/40 (53%) vitamin D deficiency.
| Variable | N.=40 |
|---|---|
| Age, years | 53 [45-64] |
| Male gender, N. | 20 (50) |
| Body Mass Index, kg/m2 | 25.0 [22.6-27.1] |
| Aspartate aminotransferase, U/L | 36 [25-62] |
| Alanine aminotransferase, U/L | 49 [32-89] |
| Platelet Count, ×109/L | 196 [146-238] |
| FIB-4, ≤3.25 / >3.25 | 30 (75) / 10 (25) |
| Liver Stiffness, kPa | 7.0 (4.6-10.4) |
| Viral genotype HCV-1 HCV-2 HCV-3 HCV-4 |
10 (25) 25 (63.5) 4 (10) 1 (2.5) |
| Serum HCV RNA, IU/mL (×106) | 1.73 [0.45-7.55] |
| Serum 25-hydroxycholecalciferol, ng/mL | 19.3 [13.8-33.4] |
| Serum PTH, pg/mL | 33.7 [26.3-53.1] |
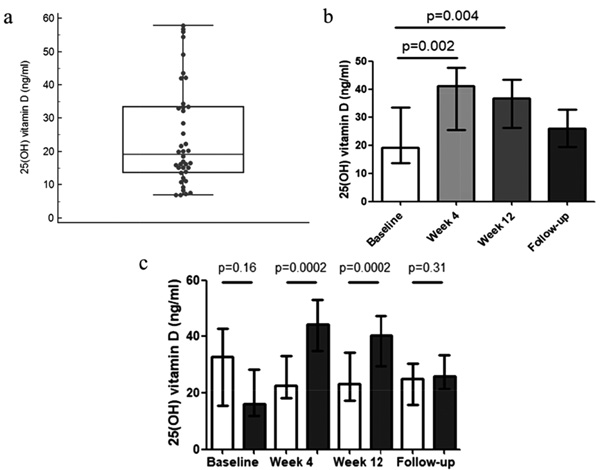
In Fig. (1b) we report the median plasma 25(OH) vitamin D concentrations at TW4 and TW12 and in the follow-up, which were, respectively 41.1 [25.3-47.6] ng/mL, 36.6 [26.1-43.3] ng/mL and 26.0 [19.5-32.6] ng/mL. Considering the entire study population, 25(OH) vitamin D plasma concentration increased significantly at TW4 (p=0.002) and TW12 (p=0.004), returning to values comparable to baseline in the follow-up period (p=0.31). However, as expected, only patients who underwent cholecalciferol supplementation showed an increase in plasma vitamin D concentration (difference between the two groups: p=0.005 at the analysis of the variance for repeated measurements); in fact, as shown in Fig. (1c), the supplemented group ameliorated vitamin D status from baseline (16.2 [12.0-28.4] ng/ml) to TW4 (44.2 [35.1-52.9] ng/mL; p=0.0002) and TW12 (40.3 [29.6-47.2] ng/mL; p=0.0002); at the end of follow-up, 25(OH) vitamin D plasma concentration returned to values comparable to those observed at baseline (26 [21.4-33.4] ng/mL; p=0.05). Conversely, those who did not receive vitamin D supplementation showed a slight, though not statistically significant decrease in vitamin D plasma concentration from baseline (32.9 [15.5-42.8] ng/mL): (22.8 [18.3-33.1] ng/mL at TW4, 23.3 [17.2-34.5] ng/mL at TW12, 25.0 [15.9-30.6] ng/mL at follow-up. At the end of the follow-up, no differences could be demonstrated between groups. No significant correlation between the severity of liver fibrosis and vitamin D concentrations could be observed at any time point. No significant correlation was also observed between the observed delta of vitamin D (arbitrarily defined by us as a positive or negative variation of vitamin D ≥20 ng/mL) and SVR (p=0.21).
3.2. PTH Concentration
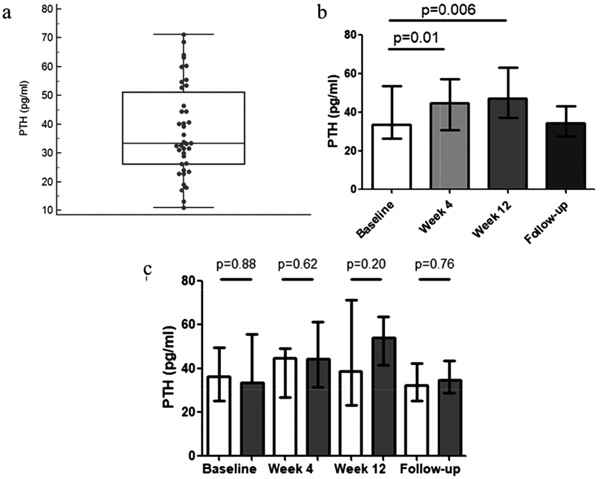
Blood PTH concentration was determined at the same time-points. The median PTH plasma concentration at baseline was 33.7 [26.3-53.3] pg/mL (Figs. 2a and b). In 39/40 (98%) of patients, PTH levels were below the threshold for hyperparathyroidism. Interestingly, we did not observe a statistical correlation between vitamin D and PTH blood levels (ρ=-0.07; p=0.65). The median PTH plasma concentration significantly increased from baseline during treatment, raising to 44.8 [30.7-57.2] pg/mL at TW4 (p=0.01), and to 47.0 [37.1-63.2] pg/mL at TW12 (p=0.006), returning to values in the follow-up (34.5 [27.6-43.0] pg/mL; p=0.16); specifically, in N.=6 and N.=10 patients plasma PTH increased at TW4 and at TW12, respectively. The proportion of patients satisfying criteria for hyperparathyroidism was higher at 12 weeks (N.=10 25%) than at 4 weeks (N.=6 15%). At the end of follow-up 2 patients (5%) still had hyperparathyroidism. Interestingly, vitamin D supplementation did not significantly affect PTH plasma concentration, as shown in Fig. 2c; in fact, PTH plasma concentration was similar in the two groups (vitamin D supplemented; not supplemented) at each time points. No significant correlation between the severity of liver fibrosis and PTH concentrations could be observed at any time point. No significant correlation was also observed between the observed delta of PTH (arbitrarily defined by us as a positive or negative variation of PTH ≥4 pg/mL) and SVR (p=0.91).
3.3. 25 (OH) Vitamin D and PTH Concentrations According to Seasons
According to the Societas Meteorologica Palatina classification which has been followed since 1780 by professional meteorologists, for temperate areas in the Northern hemisphere (where the present study was conducted), meteorological seasons have the following durations: spring begins on 1 March, summer on 1 June, autumn on 1 September, and winter on 1 December. Start of antiviral therapy was as follows in our casuistry of patients: spring: N.=7; summer: N.=4; autumn: N.=17; winter: N.=12. There was a trend towards a seasonal influence on 25(OH) vitamin D plasma concentrations (p=0.057), while PTH showed no significant seasonal modifications (p=0.3).
3.4. Hepatitis C Virological Outcomes and Relationship With Vitamin D/PTH Levels
Twelve patients (30%) obtained a rapid virological response (RVR, i.e. a negative HCV RNA at TW4); 31 (77%) patients achieved a complete early virological response (cEVR, i.e. a negative viraemia at TW12). The treatment, according to the technical schedule for the different genotypes, was completed by 38 patients (95%). A similar percentage was found with regard to the virological response at the end of therapy (ETR): 95% (38/40). All patients completed the planned follow-up of 24 weeks after the end of treatment. The final percentage of SVR was 80% (32/40), since 6 relapses (15%) occurred, with the following rates in genotype 1, 2, 3 and 4 respectively: 60%, 84%, 100%, 100%.
The comparison between the vitamin D supplemented group and the control arm with the Mann-Withney test showed no significant differences in RVR (respectively 7/13 vs. 5/27, p = 0.07), ETR (12/13 vs. 26/27, p=0.42), SVR (9/13 vs. 22/27, p=0.41), and relapse (2/13vs. 4/27, p=0.48) rates. Similarly, no significant correlation was observed between the delta of PTH and RVR (p=0.38 at the Mann-Whitney test) or SVR (p=0.91 at the Mann-Whitney test).
Neither basal vitamin D nor PTH levels demonstrated to be good independent variables when a logistic regression analysis was conducted, considering RVR as a dependent variable and parameters such as a viral genotype, IL28b genotype 9860 and advanced fibrosis as other independent variables. The same was true when SVR was considered as a dependent variable.
4. DISCUSSION
In the present paper, we demonstrate that an increase in plasma PTH concentration is to be expected to occur in most patients who undergo an IFN-based antiviral regimen to treat HCV, up to one-quarter of whom will reach PTH values consistent with secondary hyperthyroidism. This effect is not prevented by the correction of an associated vitamin D deficiency. The possibility of inducing secondary hyperparathyroidism should be considered among the side effects of IFN treatment; this issue needs to be discussed at the light of the knowledge of IFN actions and of the complex control of hormones regulating mineral bone metabolism and calcium homeostasis.
The antiproliferative actions of IFN, a cytokine with multiple effects on different cell lineages, have long been known. IFN was considered a “miracle drug for cancer” long before the current era of biologics and target therapies. The authors are well aware however that in recent years, the importance of IFN-based therapies has been greatly reduced in medical therapy, remaining at the moment the prerogative of a few morbid conditions such as chronic myeloid leukemia and rare cases of solid neoplasms (e.g. non-muscle invasive bladder cancer and renal carcinoma). In the hepatological field, IFN has been a partner in the treatment of HCV for three decades and has played an important role in curing many patients and reducing their subsequent risk of cirrhosis or hepatocellular carcinoma. More recently, it has indeed been supplanted, at least in most countries with highest gross domestic product per capita, by the much more effective and tolerable treatments with DAAs, while it still plays a marginal role in the treatment of hepatitis B and D. However, it should not be forgotten that penetration of new interferon-free therapies into standard management plans in so-called less developed countries, which account for two thirds of the world total population, has been very slow: the delay in making these drugs available to patients is their high cost which is still limiting uptake, irrespective of whether funding is patient-based or by government reimbursement. As a matter of fact, the Asian Pacific Association for the Study of the Liver (APASL) still considers PEG-interferon + ribavirin as a valid, although of the second choice, option in DAA-unaffordable countries, especially in genotype 1 and 4 naive patients [18].
In any case, the objective of the present study, which is based on a historical casuistry, was not to analyze the clinical efficacy of a treatment as dated as PEG-IFN-alpha, but to analyze possible strange and unexpected effects of such a therapy that has been shown over the years to have pleiotropic effects both in a positive and negative sense. More specifically, we tested how this therapy modifies the homeostasis of vitamin D and PTH (and therefore also of calcium and phosphorus) and, from this specific point of view, therefore, our study is to be considered innovative. We were in fact intrigued that unexpectedly we found a gap in the medical literature for what concerns with the specific item. Indeed, the first clinical works suggesting a possible gain in effectiveness if there were a concomitant supplementation of vitamin D to PEG-IFN based regimes were not followed, at least to the best of our knowledge, by any basic or translational study aimed at explaining the possible underlying physiopathological mechanisms. In any case, being strong inhibitory of fibroblasts and of collagen synthesis, it is conceivable that IFN may affect bone metabolism, although to what extent and even in which direction is controversial. For example, there have been reports showing that osteoblasts and bone deposition but also osteoclasts and bone resorption are inhibited by IFN in vitro. Moreover, children undergoing IFN treatment for hepatitis B have significantly higher PTH levels but also higher bone mineral density than age-matched healthy controls. In another small study (N.=19), crosslinked telopeptide type-I collagen levels decreased significantly after IFN treatment for essential thrombocythemia. In the same study, both vitamin D and PTH were numerically but not statistically higher after treatment than pre-treatment; interestingly, however, post-treatment serum calcium concentrations were inversely related to the cumulative IFN dose received [19]. These findings were interpreted by the authors as suggestive of modulation of bone remodelling with suppression of the resorption sequence during IFN treatment.
Two-thirds of the patients that we report here were vitamin D deficient or insufficient, a proportion in line with other studies considering the 30 ng/mL cutoff to define normal values [20]. It is well known that vitamin D is dysregulated in chronic liver disease as well as in other inflammatory diseases [21], an observation which does not necessarily translate into an improvement of these diseases following the correction of vitamin D deficit. In fact, the authors of a recent Cochrane review, based on 15 randomized trials comprising 1,034 patients with the chronic liver disease, could not decide whether vitamin D supplements have an important effect on all-cause mortality, liver-related mortality, or on serious or non-serious adverse events [22]. This issue cannot thus certainly be settled by the present data. More modestly, here we intended to ascertain what happens to the vitamin D/PTH balance when IFN is given to patients with or without supplementation with vitamin D. Active vitamin D acts as a negative regulator of PTH gene expression, though through incompletely understood mechanisms [23]. On the other hand, with a classic negative feedback mechanism, PTH converts 25-hydroxyvitamin D to its most active metabolite, 1,25-dihydroxyvitamin D-3, by activation of the enzyme 1-hydroxylase in the proximal tubules of the kidney. The present series demonstrate clearly that vitamin D supplementation does not prevent IFN-induced PTH increase. In fact, there were no significant differences in PTH levels between patients supplemented or not with vitamin D. This finding is at variance with what occurs in other kinds of secondary hyperparathyroidism, where vitamin D helped in the regulation of PTH levels in a dose-dependent manner [24]. The benefits of cholecalciferol supplementation are apparent in rheumatoid arthritis [25], where a correlation exists between vitamin D levels and secondary hyperparathyroidism [26]. In other words, the tightly controlled feedback cycle between PTH and vitamin D does not seem to be operating in the setting we studied. We can only speculate why.
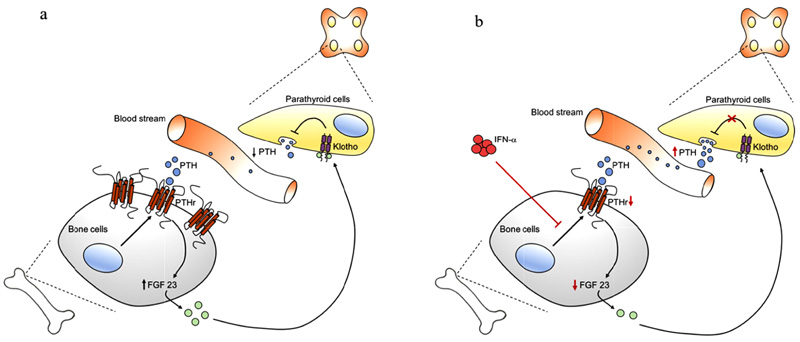
Under physiological conditions, a crosstalk exists between PTH and vitamin D, resulting in a classic negative feedback loop. PTH increases the level of CYP27B1, the gene coding for 1-alpha-hydroxylase that converts vitamin D in its active form, i.e., 1,25 vitamin D. In turn, stimulation of the vitamin D receptor on parathyroid gland cells by 1,25 vitamin D decreases PTH synthesis and secretion, inhibits PTH cell proliferation, and increases the expression of the calcium-sensing receptor. Both PTH and 1,25 vitamin D act in concert with the more recently discovered fibroblast growth factor 23 (FGF23) and Klotho [27]. When PTH binds to the PTH receptor, the signal transduction implicates an increase in FGF23 secretion by bone cells into the bloodstream. FGF23 in the circulation finds its receptors Klotho (which build a complex with FGF23 receptor 1) also on parathyroid cells. When activated by FGF23, the complex Klotho/FGF23R1 inhibits PTH synthesis and, consequently, PTH secretion into the blood circulation (Fig. 3a).
This is one, among several mechanisms, that allows the organism to maintain a balance and PTH in a normal range.
We propose that the increase in PTH observed after PEG-IFN-α is caused by interference with this latter pathway, although we can only provide clues for this hypothesis. In fact, PTH receptor expression on the plasma membrane of a bone cell line is reduced by interferon [28]. A significant lower expression of PTH receptors is expected to impair FGF23 secretion that would result in a reduction of FGF23-mediated PTH release inhibition on parathyroid gland cells. The final effect would be a significant increase in PTH levels resulting in drug-induced secondary hyperparathyroidism (Fig. 3b). Another clue is that low-dose IFN-α inhibits melanoma cell proliferation by interference with the autocrine growth circuit of FGF-2, a fibroblast growth factor belonging to the same family [29], an effect recently exploited to suppress FGF-2 in patients with metastatic melanoma [30].
CONCLUSION
In conclusion, for the first time, we show that PEG-IFN-α treatment is consistently associated with increased PTH levels and, often, secondary hyperparathyroidism that is not prevented by vitamin D. The mechanism might involve an interaction with other PTH regulatory hormones, a hypothesis that needs to be tested in specifically designed studies. Meanwhile, we caution clinicians using PEG-IFN-α to consider secondary hyperparathyroidism among the long list of possible side effects of this drug.
LIST OF ABBREVIATIONS
| HCV | = Hepatitis C Virus |
| PEG | = Pegylated |
| IFN | = Interferon |
| PTH | = Parathyroid Hormone |
| TW | = Treatment Week |
| RVR | = Rapid Virological Response |
| CEVR | = Complete Early Virological Response |
| ETR | = Virological response at the end of therapy |
| SVR | = Sustained Virologic Response |
| DAAs | = Direct-Acting Antivirals |
| TE | = Transient Elastography |
| FIB-4 | = Fibrosis-4 |
| LS | = Liver Stiffness |
| AST | = Aminotransferase |
| ALT | = Alanine Aminotransferase |
| IQR | = Interquartile Ranges |
| FGF | = Fibroblast Growth Factor |
ETHICS APPROVAL AND CONSENT TO PARTICIPATE
This study has been approved by the Research Ethics Committee of “Maggiore della Carità” Hospital, Novara, Italy.
HUMAN AND ANIMAL RIGHTS
No Animals were used in this research. All human research procedures followed were in accordance with the ethical standards of the committee responsible for human experimentation (institutional and national), and with the Helsinki Declaration of 1975, as revised in 2013.
CONSENT FOR PUBLICATION
A written informed consent was obtained from all patients when they were enrolled.
CONFLICT OF INTEREST
The authors declare no conflict of interest, financial or otherwise.
ACKNOWLEDGEMENTS
Declared none.