All published articles of this journal are available on ScienceDirect.

Fibromyalgia Syndrome among Men and Women: Symptom Identification, Diagnosis, and Concurrence in a Nationally Representative Sample
Abstract
Introduction/Objective
Fibromyalgia Syndrome (FMS) is characterized by chronic musculoskeletal pain and, no reliable biomarkers, diagnosis is difficult. While predominantly identified in women, men are also affected. This study examined FMS prevalence and racial/ethnic differences in clinical characteristics by gender.
Methods
We identified respondents in the 2018 National Health Interview Survey (NHIS) whose symptomology matched the 2016 American College of Rheumatology (ACR) diagnostic criteria. The relative likelihood of having “identified FMS,” “clinically diagnosed FMS”, and “concurrently identified-diagnosed FMS” among men and women reporting pain was compared by demographic, socioeconomic, and geographic characteristic.
Results
Analyses indicated different characteristics were associated with identified, diagnosed, and concurrent FMS among women and men. Among both women and men, the likelihood of identified FMS was comparatively higher among those at older ages, living in the South, and with higher body masses. Both women and men earning less than $100,000 had a higher likelihood of FMS identification compared to higher earners; however, the likelihood of being diagnosed with FMS was not correlated with income. While Black women were significantly more likely than White women to be identified as having FMS, they were less likely to have an FMS diagnosis. Black men were significantly more likely to be identified as having FMS, but less likely to have an FMS diagnosis. Compared to White women, Black and Hispanic women had a lower likelihood of concurrent FMS.
Conclusion
Results showed lower incidence rates of males with FMS. Unexplained racial differences in FMS diagnosis, identification, and concurrence warrant further research.
1. INTRODUCTION
Fibromyalgia Syndrome (FMS) is a chronic pain disorder characterized by heightened sensitivity to pain with episodes of generalized pain experienced simultaneously throughout the body, complaints of fatigue, compromised physical function, and disturbed sleep. FMS is frequently accompanied by depression, anxiety and cognitive dysfunction often referred to as ‘fibro fog”. To date, there is no known etiological explanation for the development of FMS [1-6]. While there are ongoing efforts to identify and validate a reliable diagnostic biomarker of FMS [7], there currently exists neither national nor international consensus regarding biological indicators to clearly diagnose FMS. Rather it is formally diagnosed through an evaluation of symptomology and elimination of other suspected conditions–a process which has been reported to take, on average, up to five years [7, 8].
This syndrome has been reported to affect over 4 million US adults, 80% to 96% of whom are shown to be women [9]. This large female dominance has been attributed to gender differences in the response to pain with females being more sensitive and having a higher risk of clinical pain compared to males [3, 9-11]. This large difference between males and females has resulted in less knowledge about clinical characteristics in male patients with FMS [11]. Additional unknowns include potential racial/ethnic differences in clinical characteristics of FMS. For example, FMS is reported to be more prevalent among White adults than Black, Hispanic, Asian, American Indian, or other individuals [12]. While no known etiological differences explain this disparity, some scholars have cited factors within the healthcare system related to differential treatment of pain and pain-related diagnoses between Black adult patients and White adult patients [12]. Others have suggested that differences in diagnosis rates may be the result of health care providers being less likely to believe the pain that people of historically marginalized groups’ report [13].
While some studies have indicated various individual, environmental, and social factors associated with FMS diagnosis and/or symptomology, little is known about such characteristics associated with FMS diagnosis and symptoms in both genders [11, 14]. This study sought to fill the gap in research by evaluating the individual, environmental, and social characteristics associated with clinical FMS diagnosis (diagnosed FMS); identification of symptomology satisfying the American College of Rheumatology (ACR) 2016 Diagnostic Criteria for FMS (identified FMS) [15]; and concurrence of both diagnosed and identified FMS (concurrent FMS) among male and female adults who reported experiencing pain some, most, or every day in the last three months. Using a nationally representative sample of US adults, this study evaluated the association between age, gender, race, income, body mass index (BMI), region of residence, household size and the likelihood of diagnosed FMS, identified FMS, and concurrent FMS. Addressing the body of literature documenting gender differences in pain in the general population and higher prevalence of clinical pain among women [3, 9-11], gender-specific regressions evaluated men and women separately.
2. METHODS
2.1. Data
This study utilized the 2018 National Health Interview Survey (NHIS)--a cross sectional household interview survey targeting the civilian noninstitutionalized population administered to monitor population health through the collection and analysis of data on a broad range of health topics. The NHIS allows these health characteristics to be categorized by many demographic, socioeconomic, and contextual characteristics illustrating timely issues such as prevalent health problems, and barriers to accessing and using appropriate health care. While NHIS has released data for more recent years, a survey redesign in 2019 removed two data elements which made identification of FMS diagnosis possible. The question asking, “Have you EVER been told by a doctor or other health professional that you have some form of arthritis, rheumatoid arthritis, gout, lupus, or fibromyalgia?” as well as those relating to the location (shoulder, arm, leg, back, neck, face, and jaw) of pain were removed. Therefore, 2018 data was used for this analysis.
Using the 2018 NHIS survey data we assessed for individuals with diagnosed, identified, or concurrent FMS. Survey respondents were considered to have a diagnosis of FMS if they affirmed that they had both 1) seen a doctor or other health professional for joint pain/stiffness/swelling, and 2) been told by a doctor or other health professional that they had some form of arthritis, rheumatoid arthritis, gout, lupus, or fibromyalgia, but did not report a diagnosis of arthritis or rheumatic arthritis. That is, the survey provided separate question items for having received a diagnosis of fibromyalgia, arthritis, or rheumatoid arthritis; however, it did not include separate question items for gout or lupus. Therefore, we cannot rule out these potential confounders.
The sample included all NHIS respondents aged 18 years and older who completed the Adult Health Status and Limitations (AHSL) Questionnaire [16] who indicated that in the past 3 months they had experienced pain on some days, most days, or every day. Individuals who were pregnant at the time of the survey were excluded from the sample. Publicly available data; Approval not required
2.2. Outcomes
Three binary outcome variables were created from the NHIS questionnaire: diagnosed FMS, identified FMS, and concurrent FMS.
2.2.1. Diagnosed FMS
Respondents were considered to have an FMS diagnosis if they affirmed that they had both 1) seen a doctor or other health professional for join pain/stiffness/swelling and, 2) been told by a doctor or other health professional that they have some form of arthritis, rheumatoid arthritis, gout, lupus, or fibromyalgia. An option was not provided in the NHIS for respondents to report having received a diagnosis of gout or lupus; only if they had a diagnosis of fibromyalgia, arthritis, or rheumatism. Only those respondents who self-identified as having received a diagnosis of FMS met inclusion criteria for FMS diagnosis.
2.2.2. Identified FMS
Respondents were “identified” as having FMS if the NHIS data demonstrated an individual having met the three conditions for FMS diagnosis as established by the 2016 Fibromyalgia Diagnostic Criteria [15].
1. Widespread pain index (WPI) ≥7 and symptom severity scale (SSS) score ≥5, or WPI of 4∼6 and SSS score ≥9.
a. WPI: The number of areas in which the respondent has had pain over the past week generating a score between 0 and 19.
b. SSS: The symptom severity scale assesses severity of fatigue, unrefreshing sleep, and cognition on a scale from zero to three ranging from 0=no problem, 1=slight or mild problems, generally mild or intermittent, 2=moderate, considerable problems, often present and/or at a moderate level, and 3=severe: pervasive, continuous, life-disturbing problems. The SSS score is the sum of the severity scores of the three symptoms (fatigue, waking unrefreshed, and cognitive symptoms) (0∼9), plus the sum (0∼3) of the: headaches (0∼1), pain or cramps in lower abdomen (0∼1), and depression (0∼1). Because abdominal pain was not available in the NHIS, only depression and headaches were used, resulting in a final score between 0 and 11.
2. Generalized pain, defined as pain in at least four of five regions, must be present.
a. All areas of pain were identified in the NHIS, except for the chest and abdomen, allowing for the identification of pain in all five regions if reported.
3. Symptoms have been generally present for at least 3 months.
a. NHIS respondents indicated whether they experienced pain never, some days, most days, or every day. Those reporting pain on some, most, or every day were assumed to satisfy this criterion.
2.3. Covariates
The following contextual and individual characteristics were included in the regression model to account for heterogeneity in the sample. Those categories marked with “*” were included in the reference group.
Contextual Characteristics: Household size (one to nine people), household income ($0-$34,999, $35,000-$74,999, $75,000-$99,999, $100,000 and above*), insurance (insured,* uninsured), region of residence (Northeast,* Midwest, West, South).
Individual Characteristics.: Age (18 and above), gender (male, female), race/ethnicity (White, Black, Other race, Hispanic), current employment status (working,*), marital status (married, unmarried*), educational attainment (less than high school, high school/associate degree, college and above*).
2.4. Statistical Analysis
The characteristics of males and females were compared using the Student’s t-test for continuous variables and the chi-square test for categorical variables. First, we evaluated the unadjusted relative likelihood diagnosed, identified, and concurrent FMS among men and women. Second, we constructed a multivariable logistic regression model to analyze the adjusted likelihood of diagnosed, identified, and concurrent FMS among the male and female cohorts. All confounders were included in the model for multivariable adjustment. Income and education were both included as categorical independent variables to avoid multicollinearity.
Logistic regression assessed the relationship between individual and contextual characteristics and identified, diagnosed, and concurrent FMS. The results of the logistic regression models are presented as odds ratio (OR) with 95% confidence intervals (CIs). Using a variance inflation factor < 2.0, we confirmed that multicollinearity occurred in none of the multivariable models. Additionally, we performed the Hosmer–Lemeshow test [17] to examine the goodness-of-fit of the multivariable models for the entire cohort. A receiver operating characteristic (ROC) analysis was performed for validation purposes in this study. NHIS geographic stratification and household clustering parameters were included in the estimation procedure to account for complex survey sampling procedures. Estimates were weighted to reflect a nationally representative sample. Adjusted odds ratios diagnoses were calculated to facilitate interpretation of results. All analyses were performed separately for men and women using SAS survey procedures.
3. RESULTS
3.1. Sample Descriptive Characteristics
Characteristics for the male (N=6,979) and female (N=8,753) cohorts are provided in Table 1. On average, males and females were 53 (SD=17.51) and 55 (SD=18.08) years old, respectively, living in 2 to 3 (SD=1.35) person households. Males had an average BMI of 29.49 (SD=8.67) while females had an average BMI of 31.46 (SD=15.37) a statistically significant difference (χ2=-9.53, p<0.0001). Roughly 70% of males and 67% of females were White adults with smaller representations among Black adults (male 10%, female 12%), Hispanic adults (male 14%, female 13%), and other adult racial groups (male 7%, female 8%). These racial and ethnic differences were statistically significant (χ2=38.91, p<0.0001). Males and females were distributed similarly (χ2= 6.36, p=0.1034) throughout the four geographic regions (Males: Northeast 16%, Midwest 23%, South 36%, West 24%; Females: Northeast 17%; Midwest 23%; South 37%; West 23%). Over 45% of males earned over $75,000 compared to only 40% of females (χ2= 131.28, p<0.0001).
| - | Male | Female | - | - | ||
|---|---|---|---|---|---|---|
| N | 6,979 (44%) | 8,753 (55.6%) | - | - | ||
| - | Mean | Std Dev | Mean | Std Dev | t-Statistic | p-Value |
| Age | 53.01 | 17.51 | 55.07 | 18.08 | -6.9 | <.0001 |
| Body Mass Index (BMI) | 29.49 | 8.67 | 31.46 | 15.37 | -9.53 | <.0001 |
| Size of family | 2.22 | 1.35 | 2.22 | 1.37 | -0.08 | 0.9333 |
| - | N | Percent | N | Percent | χ2 Statistic | p-Value |
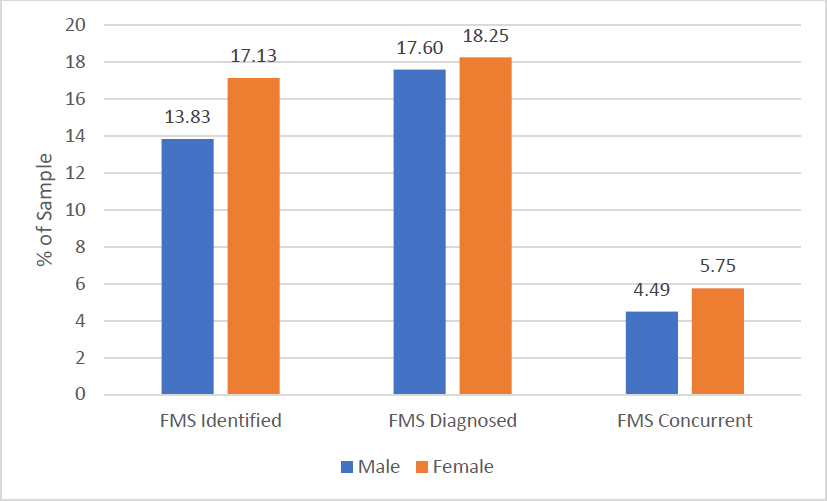
| FMS identified | 1051 | 13.83 | 1618 | 17.13 | 40.30 | <.0001 |
| FMS Diagnosed | 1353 | 17.60 | 1745 | 18.25 | 0.74 | 0.4019 |
| FMS Concurrent | 362 | 4.49 | 520 | 5.75 | 5.96 | 0.0146 |
| Marred | 3475 | 57.36 | 3655 | 51.18 | 101.61 | <.0001 |
| Working | 4131 | 64.28 | 4231 | 52.87 | 183.72 | <.0001 |
| No insurance | 650 | 10.31 | 589 | 7.32 | 35.93 | <.0001 |
| White only | 5165 | 68.90 | 6151 | 66.64 | 38.91 | <.0001 |
| Black only | 659 | 10.02 | 1038 | 11.89 | - | - |
| Other/multiple races | 494 | 7.22 | 593 | 8.00 | - | - |
| Hispanic | 661 | 13.86 | 971 | 13.46 | - | - |
| Northeast | 1059 | 15.60 | 1416 | 17.47 | 6.36 | 0.1034 |
| Midwest | 1773 | 23.89 | 2113 | 22.87 | - | - |
| South | 2476 | 36.46 | 3180 | 36.50 | - | - |
| West | 1671 | 24.05 | 2044 | 23.15 | - | - |
| Less than high school | 741 | 11.45 | 1035 | 11.38 | 5.60 | 0.0813 |
| High school/associate degree | 4007 | 57.81 | 4953 | 56.88 | - | - |
| College and above | 2203 | 30.74 | 2735 | 31.74 | - | - |
| $0-$34,999 | 1953 | 23.74 | 3139 | 29.89 | 131.28 | <.0001 |
| $35,000-$74,999 | 2081 | 30.72 | 2357 | 29.49 | - | - |
| $75,000-$99,999 | 934 | 14.19 | 970 | 12.90 | - | - |
| $100,000 and above | 1599 | 31.36 | 1660 | 27.72 | - | - |
Calculations account for the NHIS clustered and stratified sampling methodology
About 18% of male and 18% females had diagnosed FMS (χ2=0.74, p=0.40). Over 17% of females had identified FMS compared to only 13.83% of males (χ2=32.25, p<0.0001). Females had a slightly larger proportion with concurrent FMS (5.75%) than males (4.49%) a statistically significant difference (χ2= 5.96, p<0.0001). These differences are depicted in Fig. (1).
3.2. Logistic Regression Analysis
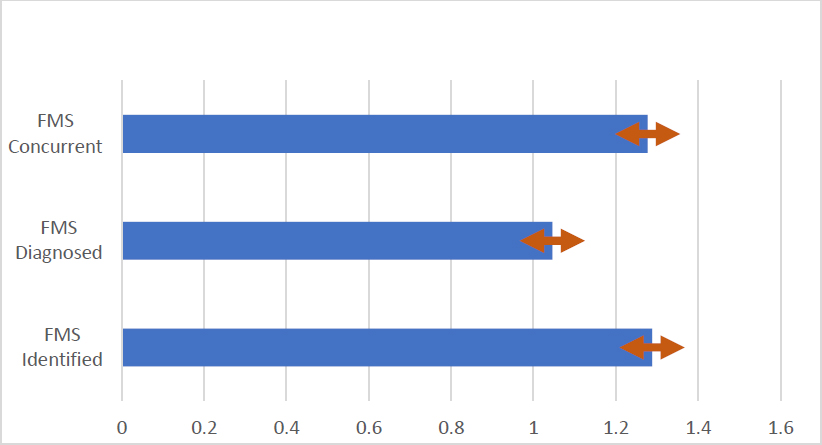
Results for males and female regression models are listed in Tables 2-4 for diagnosed, identified, and concurrent FMS, respectively. Gender differences in the adjusted likelihood are depicted in Fig. (2) while significant findings from each model are discussed below.
| - | Male | Female | ||||||||||||
|---|---|---|---|---|---|---|---|---|---|---|---|---|---|---|
| N | 6979 | - | - | - | - | - | - | 8753 | - | - | - | - | - | - |
| Chi-Square | 16.68 | <.0001 | - | - | - | - | - | 17.59 | <.0001 | - | - | - | - | - |
| - | Estimate | Std Err | t Value | Pr > |t| | Odds Ratio | Estimate | Std Err | t Value | Pr > |t| | Odds Ratio | ||||
| Intercept | -11.18 | 1.02 | -10.97 | <.0001 | - | 95% CI | -7.39 | 0.63 | -11.67 | <.0001 | - | 95% CI | ||
| Age | 1.91 | 0.18 | 10.61 | <.0001 | 6.74 | 4.74 | 9.61 | 1.29 | 0.13 | 9.75 | <.0001 | 3.62 | 2.79 | 4.69 |
| BMI | 0.54 | 0.19 | 2.77 | 0.0058 | 1.71 | 1.17 | 2.50 | 0.19 | 0.11 | 1.74 | 0.082 | 1.21 | 0.98 | 1.49 |
| Family size | 0.09 | 0.11 | 0.87 | 0.3839 | 1.10 | 0.89 | 1.35 | -0.22 | 0.09 | -2.43 | 0.0154 | 0.81 | 0.68 | 0.96 |
| Married | 0.04 | 0.05 | 0.76 | 0.4499 | 1.09 | 0.88 | 1.34 | 0.08 | 0.05 | 1.65 | 0.0995 | 1.18 | 0.97 | 1.43 |
| Working | -0.05 | 0.06 | -0.86 | 0.3895 | 0.91 | 0.73 | 1.13 | 0.03 | 0.04 | 0.67 | 0.5029 | 1.06 | 0.90 | 1.24 |
| No insurance | -0.07 | 0.09 | -0.80 | 0.4264 | 0.87 | 0.62 | 1.23 | -0.18 | 0.09 | -2.02 | 0.0444 | 0.70 | 0.49 | 0.99 |
| Black | 0.00 | 0.13 | 0.04 | 0.97 | 0.83 | 0.61 | 1.12 | -0.26 | 0.12 | -2.27 | 0.0236 | 0.56 | 0.41 | 0.76 |
| Other/multiple races | -0.23 | 0.13 | -1.74 | 0.0817 | 0.65 | 0.47 | 0.91 | -0.06 | 0.09 | -0.66 | 0.5078 | 0.69 | 0.54 | 0.87 |
| Hispanic | 0.03 | 0.11 | 0.24 | 0.8127 | 0.84 | 0.65 | 1.09 | 0.01 | 0.10 | 0.08 | 0.9394 | 0.74 | 0.58 | 0.93 |
| Midwest | 0.06 | 0.08 | 0.78 | 0.4354 | 1.16 | 0.89 | 1.50 | 0.11 | 0.07 | 1.65 | 0.0992 | 1.25 | 0.99 | 1.59 |
| South | -0.02 | 0.07 | -0.31 | 0.7556 | 1.07 | 0.84 | 1.36 | -0.01 | 0.05 | -0.09 | 0.9263 | 1.12 | 0.90 | 1.38 |
| West | 0.05 | 0.07 | 0.64 | 0.521 | 1.14 | 0.89 | 1.48 | 0.01 | 0.06 | 0.16 | 0.8705 | 1.13 | 0.90 | 1.43 |
| Less than HS | -0.18 | 0.10 | -1.78 | 0.0754 | 0.82 | 0.60 | 1.13 | 0.09 | 0.08 | 1.07 | 0.287 | 1.22 | 0.93 | 1.59 |
| HS/associate degree | 0.16 | 0.06 | 2.66 | 0.0081 | 1.15 | 0.97 | 1.36 | 0.03 | 0.05 | 0.51 | 0.6084 | 1.15 | 0.97 | 1.36 |
| $0-$34,999 | 0.01 | 0.08 | 0.11 | 0.9091 | 0.94 | 0.74 | 1.21 | -0.13 | 0.08 | -1.66 | 0.0969 | 0.79 | 0.62 | 1.01 |
| $35,000-$74,999 | -0.10 | 0.07 | -1.55 | 0.1221 | 0.84 | 0.67 | 1.05 | 0.04 | 0.06 | 0.68 | 0.4942 | 0.94 | 0.76 | 1.16 |
| $75,000-$99,999 | 0.03 | 0.08 | 0.33 | 0.7378 | 0.96 | 0.74 | 1.25 | -0.01 | 0.07 | -0.17 | 0.8664 | 0.89 | 0.69 | 1.15 |
Probability modeled is FMS Diagnosed=1.
Estimates weighted to reflect national population.
Regression account for survey framework and sampling methodology.
Sample includes individuals reporting pain in the last 3 months.
Reference: Region (Northeast); Race (White); Ethnicity (non-Hispanic); Income group (≥ $100,000); Marital status (unmarried); Employment (not working); Insurance (insured); Education (college degree or above).
| - | Male | Female | ||||||||||||
|---|---|---|---|---|---|---|---|---|---|---|---|---|---|---|
| N | 6979 | - | - | - | - | - | - | 8,753 | - | - | - | - | - | - |
| - | Estimate | P-Value | - | - | - | - | - | Estimate | P-Value | - | - | - | - | - |
| Chi-Square | 10.24 | <.0001 | - | - | - | - | - | 12.06 | <.0001 | - | - | - | - | - |
| - | Estimate | Std Err | t Value | Pr > |t| | Odds Ratio | Estimate | Std Err | t Value | Pr > |t| | Odds Ratio | ||||
| Intercept | -5.78 | 0.80 | -7.24 | <.0001 | - | - | -5.16 | 0.57 | -9.08 | <.0001 | - | - | ||
| Age | 0.48 | 0.14 | 3.36 | 0.0008 | 1.62 | 1.22 | 2.14 | 0.49 | 0.12 | 4.13 | <.0001 | 1.63 | 1.29 | 2.06 |
| BMI | 0.57 | 0.18 | 3.24 | 0.0013 | 1.77 | 1.25 | 2.49 | 0.46 | 0.11 | 4.27 | <.0001 | 1.59 | 1.28 | 1.96 |
| Family size | 0.11 | 0.11 | 0.95 | 0.3444 | 1.11 | 0.89 | 1.39 | -0.09 | 0.08 | -1.04 | 0.2997 | 0.92 | 0.78 | 1.08 |
| Married | -0.05 | 0.06 | -0.76 | 0.449 | 0.91 | 0.72 | 1.16 | -0.03 | 0.05 | -0.75 | 0.4555 | 0.93 | 0.78 | 1.12 |
| Working | -0.24 | 0.05 | -4.42 | <.0001 | 0.62 | 0.50 | 0.77 | -0.24 | 0.04 | -5.85 | <.0001 | 0.62 | 0.53 | 0.73 |
| No Insurance | 0.07 | 0.08 | 0.96 | 0.3369 | 1.16 | 0.86 | 1.56 | -0.07 | 0.08 | -0.79 | 0.4284 | 0.88 | 0.63 | 1.21 |
| Black | 0.28 | 0.13 | 2.13 | 0.0336 | 1.09 | 1.08 | 1.48 | 0.06 | 0.12 | 2.50 | 0.02662 | 1.27 | 1.17 | 1.32 |
| Other/multiple races | -0.24 | 0.13 | -1.77 | 0.0775 | 0.65 | 0.46 | 0.91 | 0.04 | 0.10 | 0.44 | 0.6566 | 0.94 | 0.74 | 1.20 |
| Hispanic | -0.23 | 0.14 | -1.69 | 0.091 | 0.65 | 0.46 | 0.93 | -0.21 | 0.10 | -2.09 | 0.037 | 0.73 | 0.58 | 0.93 |
| Midwest | 0.21 | 0.08 | 2.76 | 0.006 | 1.53 | 1.17 | 2.01 | 0.00 | 0.07 | 0.06 | 0.9536 | 0.99 | 0.79 | 1.26 |
| South | 0.03 | 0.07 | 0.40 | 0.686 | 1.28 | 0.98 | 1.66 | 0.04 | 0.06 | 2.61 | 0.05 | 1.03 | 1.01 | 1.28 |
| West | -0.03 | 0.08 | -0.35 | 0.7272 | 1.20 | 0.90 | 1.60 | -0.05 | 0.06 | -0.82 | 0.4119 | 0.94 | 0.75 | 1.18 |
| Less than HS | 0.08 | 0.11 | 0.71 | 0.4751 | 1.42 | 0.99 | 2.03 | 0.00 | 0.08 | 0.05 | 0.9597 | 1.07 | 0.81 | 1.42 |
| HS/associate degree | 0.20 | 0.07 | 2.95 | 0.0033 | 1.60 | 1.28 | 2.00 | 0.06 | 0.05 | 1.15 | 0.2487 | 1.13 | 0.94 | 1.37 |
| $0-$34,999 | -0.05 | 0.10 | -0.47 | 0.6398 | 1.24 | 0.90 | 1.71 | -0.11 | 0.09 | -1.21 | 0.225 | 1.09 | 0.81 | 1.47 |
| $35,000-$74,999 | 0.12 | 0.07 | 1.85 | 0.0642 | 1.46 | 1.12 | 1.91 | 0.12 | 0.06 | 1.90 | 0.0587 | 1.36 | 1.07 | 1.73 |
| $75,000-$99,999 | 0.19 | 0.09 | 2.03 | 0.0432 | 1.57 | 1.12 | 2.18 | 0.19 | 0.07 | 2.73 | 0.0065 | 1.47 | 1.13 | 1.92 |
Probability modeled is FMS Identified=1.
Estimates weighted to reflect national population.
Regression account for survey framework and sampling methodology.
Sample includes individuals reporting pain in the last 3 months.
Reference: Region (Northeast); Race (White); Ethnicity (non-Hispanic); Income group (≥ $100,000); Marital status (unmarried); Employment (not working); Insurance (insured); Education (college degree or above).
| - | Male | Female | ||||||||||||
|---|---|---|---|---|---|---|---|---|---|---|---|---|---|---|
| N | 6979 | - | - | - | - | - | - | 8753 | - | - | - | - | - | - |
| - | Estimate | P-Value | - | - | - | - | - | Estimate | P-Value | - | - | - | - | - |
| Chi-Square | <.0001 | - | - | - | - | - | 4.53 | <.0001 | - | - | - | - | - | |
| - | Estimate | Std Err | t Value | Pr > |t| | Odds Ratio | Estimate | Std Err | t Value | Pr > |t| | Odds Ratio | ||||
| Intercept | -10.43 | 1.48 | -7.03 | <.0001 | - | - | -6.55 | 0.83 | -7.88 | <.0001 | - | - | ||
| Age | 1.09 | 0.24 | 4.52 | <.0001 | 2.97 | 1.85 | 4.77 | 0.62 | 0.19 | 3.32 | 0.001 | 1.86 | 1.29 | 2.69 |
| BMI | 0.79 | 0.28 | 2.79 | 0.0055 | 2.21 | 1.26 | 3.86 | 0.36 | 0.14 | 2.49 | 0.013 | 1.43 | 1.08 | 1.90 |
| Family Size | 0.04 | 0.19 | 0.20 | 0.8449 | 1.04 | 0.72 | 1.50 | -0.05 | 0.13 | -0.38 | 0.7049 | 0.95 | 0.74 | 1.23 |
| Married | -0.01 | 0.09 | -0.11 | 0.9107 | 0.98 | 0.69 | 1.39 | 0.06 | 0.07 | 0.77 | 0.4443 | 1.12 | 0.84 | 1.51 |
| Working | -0.17 | 0.08 | -2.04 | 0.0414 | 0.71 | 0.51 | 0.99 | -0.08 | 0.07 | -2.29 | 0.01981 | 0.85 | 0.65 | 0.99 |
| No Insurance | 0.03 | 0.14 | 0.24 | 0.8113 | 1.07 | 0.61 | 1.88 | 0.09 | 0.13 | 0.70 | 0.4813 | 1.20 | 0.72 | 2.00 |
| Black | -0.01 | 0.23 | -0.03 | 0.9739 | 0.64 | 0.37 | 1.11 | -0.16 | 0.21 | -2.80 | 0.04224 | 0.60 | 0.35 | 0.84 |
| Other/Multiple Races | -0.30 | 0.27 | -1.12 | 0.2641 | 0.48 | 0.24 | 0.96 | -0.07 | 0.18 | -0.40 | 0.6892 | 0.66 | 0.43 | 1.02 |
| Hispanic | -0.13 | 0.22 | -0.57 | 0.5682 | 0.57 | 0.33 | 0.98 | -0.11 | 0.18 | -0.60 | 0.5496 | 0.64 | 0.41 | 1.00 |
| Midwest | 0.16 | 0.12 | 1.39 | 0.1666 | 1.27 | 0.81 | 1.99 | 0.08 | 0.11 | 0.70 | 0.485 | 1.04 | 0.72 | 1.51 |
| South | 0.12 | 0.10 | 1.15 | 0.2493 | 1.22 | 0.80 | 1.88 | -0.07 | 0.10 | -0.72 | 0.4702 | 0.90 | 0.63 | 1.28 |
| West | -0.20 | 0.11 | -1.76 | 0.0797 | 0.89 | 0.57 | 1.39 | -0.04 | 0.11 | -0.34 | 0.7321 | 0.93 | 0.65 | 1.34 |
| Less than HS | -0.23 | 0.17 | -1.35 | 0.1773 | 0.82 | 0.45 | 1.48 | 0.04 | 0.14 | 0.28 | 0.7758 | 1.17 | 0.72 | 1.90 |
| HS/associate degree | 0.26 | 0.10 | 2.47 | 0.014 | 1.33 | 1.01 | 1.93 | 0.08 | 0.08 | 0.90 | 0.3666 | 1.21 | 0.90 | 1.64 |
| $0-$34,999 | -0.12 | 0.16 | -0.71 | 0.4758 | 0.98 | 0.59 | 1.64 | -0.10 | 0.14 | -0.74 | 0.4604 | 0.95 | 0.62 | 1.47 |
| $35,000-$74,999 | 0.03 | 0.12 | 0.27 | 0.7888 | 1.14 | 0.75 | 1.74 | 0.04 | 0.10 | 0.44 | 0.6587 | 1.11 | 0.77 | 1.58 |
| $75,000-$99,999 | 0.18 | 0.15 | 1.24 | 0.2153 | 1.32 | 0.80 | 2.18 | 0.12 | 0.12 | 0.99 | 0.3209 | 1.19 | 0.79 | 1.80 |
Probability modeled is FMS Concurrent=1.
Estimates weighted to reflect national population
Regression account for survey framework and sampling methodology
Sample includes individuals reporting pain in the last 3 months
Reference: Region (Northeast); Race (White); Ethnicity (non-Hispanic); Income group (≥ $100,000); Marital status (unmarried); Employment (not working); Insurance (insured); Education (college degree or above)
3.2.1. Diagnosed FMS
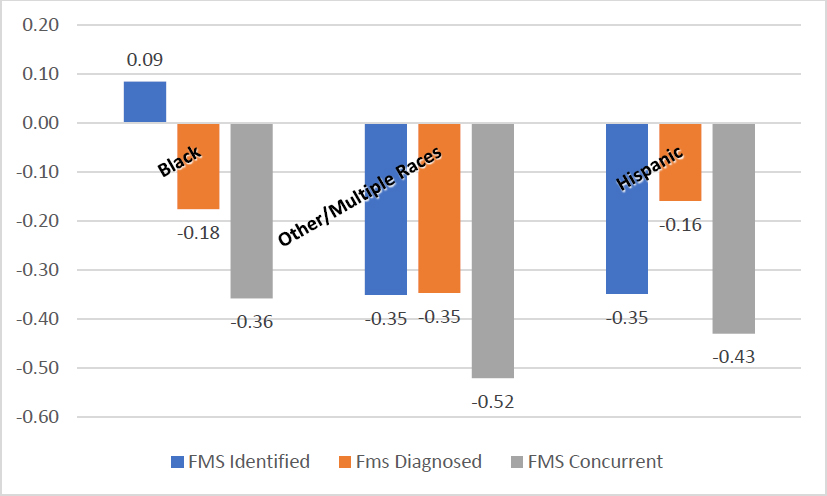
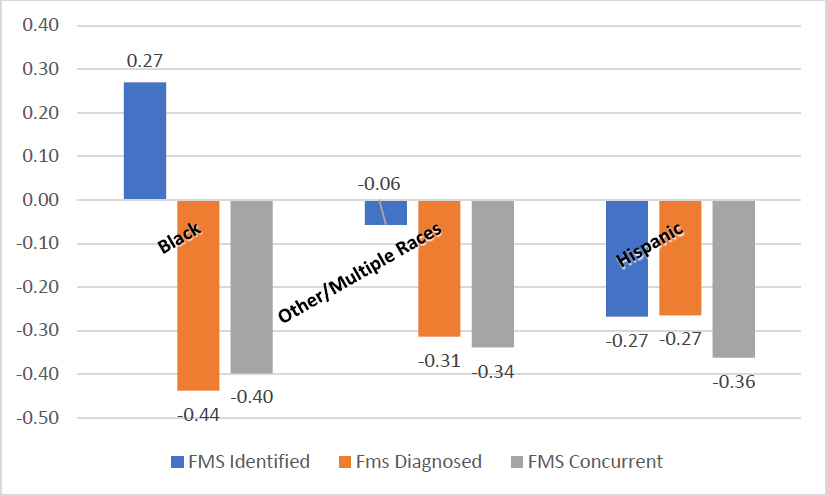
Age and BMI were significantly associated with the likelihood of diagnosed FMS for both males (Table 2 Age: OR=6.74, CI=4.74, 9.61; BMI: OR=1.71, CI=1.17, 2.50) and females (Age: OR=3.62, CI=2.79, 4.69; BMI: OR=1.21, CI=0.98, 1.49). Among males, those with a high school or associate degree were more likely to be diagnosed with FMS (OR=1.15, CI=0.97, 1.36) compared to college graduates. Among females, diagnosed FMS was less likely among Black females (OR=0.56, CI=0.41, 0.76) and those without health insurance (OR=0.70, CI=0.49, 0.99) relative to White females and those with insurance, respectively.
3.2.2. Identified FMS
Age (Table 3 male OR=1.62, CI=1.22, 2.141; female OR=1.63, CI=1.29, 2.06) and BMI (male OR=1.77, CI=1.25, 2.49; female OR=1.59, CI=1.28, 1.96) were significantly associated with the likelihood of identified FMS among both males and females. Males and females who reported being employed at least part-time were more likely to have identified FMS compared to individuals with full-time employment (male OR=0.62, CI=0.50, 0.770; female OR=0.62, CI=0.53, 0.73) while those in households earning between $75,000 and $99,999 (male OR=1.57, CI=1.12, 2.18; female OR=1.47, CI=1.13, 1.92) had a higher likelihood of identified FMS compared to households earning $100,000 and above (Fig. 3). Identified FMS was 9% (CI=1.08, 1.48) more likely among Black males than White males and 35% (CI=0.46, 0.91) more likely among males of other racial groups relative to their White counterparts. Males with a high school or associate degree (OR=1.60, CI=1.28, 2.00) were more likely than those with a college degree to have identified FMS. Compared to White females, identified FMS was 27% (CI=1.17, 1.32) more likely among Black females, but 27% (CI=0.58, 0.93) less likely among Hispanic females. Compared to women residing the Northeast, identified FMS was more likely among women residing in the South (female OR=1.03, CI=1.01, 1.28).
3.2.3. Concurrent FMS
Men and women with high BMI (Table 4 male OR=2.21, CI=1.26, 3.86; female OR=1.43, CI=1.08, 1.90) and at older ages (male OR=2.97, CI=1.85, 4.77; female OR=1.86, CI=1.29, 2.69) were significantly more likely to have concurrent FMS than their counterparts (Fig. 4). Those who were working at least part-time (male OR=0.71, CI=0.51, 0.99; female OR=0.85, CI=0.65, 0.99) were less likely to have concurrent FMS. Among females, concurrent FMS was significantly less likely among Black (OR=0.60, CI=0.35, 0.84) women relative to White women. Among males, concurrent FMS was more likely among those with a high school or associate degree (OR=1.33, CI=1.01, 1.93) compared to college graduates.
4. DISCUSSION
Using a nationally representative sample of US adults, we evaluated the association between age, gender, race, income, body mass index, region of residence, household size and the likelihood of diagnosed FMS, identified FMS, and concurrent FMS. While FMS is predominantly identified in women, men are also affected. To address the limited research literature related to men with FMS [11, 12, 18-24], we investigated FMS gender-related prevalence and characterized racial/ethnic differences in clinical characteristics among both men and women with diagnosed, identified, or concurrent FMS.
In our sample we found an equal percentage of diagnosed FMS between the genders with approximately 5% more females than males with identified FMS. The study found significantly more women with concurrent FMS compared to men, which reflects what is also found in the literature, specifically that men with FMS may not identify symptoms in the same manner as women with FMS [18, 25, 26]. Men and women may express, perceive, or convey FMS symptoms differently which was reflected in the self-reported data analyzed herein. Researchers have often noted finding that females report higher pain and symptom severity [9, 27]. These higher values could be a leading factor in the reason that females report more cases of FMS, as FMS identification by the 2016 ACR diagnostic criteria is based on symptom severity [15].
To contribute to an understanding of why less men than women are diagnosed with FMS, researchers [18] conducted a cross-sectional survey of N=1144 individuals with FMS (n=925 male; n=219 female) to examine the impacts of FMS on their quality of life, careers, relationships, and their interactions with their health-care providers. Data was collected across the span of 8 years (2009 to 2017). They reported multiple negative impacts of FMS on men that included distressed mood states, fatigue, sleep issues, inability to concentrate, fluctuating to constant states of pain, losing jobs due to missed work, and negative impact on relationships with family and friends. Reported differences in men as compared to women included belief that societal expectations of men drove their behavior in that men should be “strong”, “tough-it-out”, and serve in the “bread-winner role”. Several male respondents reported (a) feeling dismissed or misdiagnosed by their healthcare practitioners, (b) experiencing providers not believing they had FMS, and (c) being told the symptoms were “all in their head”. The authors further noted that some male respondents reported delaying seeking treatment for fear of being stigmatized as weak because FMS was a “woman’s disease” [p.955].
4.1. Age, BMI, and Disease Severity in FMS
Regarding the determination of age in the current report, age was entered as a discrete variable with the odds ratio reported in the positive direction, indicating that for each additional year of age, we see an incremental increase in the relative likelihood of the outcome. Using this strategy, we found that older age and BMI was associated with greater likelihood of FMS diagnosis and FMS identification among both men and women. These findings are in concert with research studies reporting similarly the association between agings and/or BMI and the experience of chronic pain [28-33].
Assessing symptom severity according to age categories in a sample of N=2889 individuals diagnosed with FMS (n=199 males; n=2690 females), Di Carlo et al. (29) found that patients > 71 years of age disease severity tended to have higher disease severity. Further, these findings are consistent with existing research indicating that overweight and obese women and men report greater symptom severity (30–32). For example, in a cross-sectional examination of N=110 individuals diagnosed with FMS (n=10 male; n=100 female), researchers reported 67.27% of the sample as obese/overweight and of those, there were statistically significant (p<0.05) higher percentages of FMS symptoms as compared to normal-weight individuals with FMS. Symptoms were described as morning stiffness, headache, fatigue, anxiety, and depression [31]. The authors did not denote whether symptoms were higher in men than women nor if BMI and symptoms correlated with age. High BMI scores and/or obesity has been found to be associated with a greater number of tender points, increased FMS symptom severity, and lower quality of life [33]. In their descriptive study of N=42 (n=5 male; n= 37 female) individuals diagnosed with FMS (age range 30-64 years), Núňez-Nevárez et al. [32] reported finding a positive correlation between BMI and severity of FMS symptoms (r=0.309, p=0.046). Among the concurrent FMS group in our study, BMI was the only factor found to be associated with a greater likelihood of FMS diagnosis.
4.2. Individual, Environmental, and Social Characteristics
4.2.1. Education
Education level was found to influence only FMS diagnosis in men; however, race and ethnicity were not found to have an association to these findings. That is, we report finding a likelihood of FMS diagnosis in men with a high school or associate degree. Education was neither found to be associated with identified nor concurrent FMS. In a review of the literature related to the epidemiology of FMS, Queiroz [34] reported higher prevalence rates of FMS in “low educated” individuals [p.3]; however, they did not specifically denote men and women related to this finding. In their prospective observational study of N=246 (n=22 male; n=224 female) patients diagnosed with FMS, Fitzcharles et al. [35] examined the effects of lower socioeconomic status (SES) as measured by level of education. They reported finding that those with lower level of education had greater FMS symptom severity, decreased quality of life and poorer functional abilities as compared to those with higher education.
4.2.2. Income, Employment, Insurance, Race and Ethnicity
Some studies have shown that high income earners are more likely to be diagnosed with FMS, most likely due to their more frequent interaction with the health system [35]. In the study findings reported here, age, BMI, Black race, and income between $75,000 and $99,000 was associated with a greater likelihood of FMS identification among both men and women but not diagnosis. In contrast to this in terms of income, Queiroz [34] reported higher prevalence rates of FMS in households with lower, rather than higher, incomes. In our study, employment and being a Black or Hispanic female were both found to be associated with a lower likelihood of concurrent FMS. In this data, there is a notable absence of FMS diagnosis as compared to identified or concurrent FMS categories as it applies to race and ethnicity. Our findings that those of the Black race with higher incomes only received an identification of FMS symptomatology in this analysis, and employment and being Black or Hispanic female was found only in the concurrent FMS cohort with no such findings in the FMS diagnosis cohort may be an indication of the status of overall health equity concerns. The higher likelihood of FMS identification among Black males and females has not been documented in existing literature since most current studies are based on reporting the prevalence of FMS diagnosis which has been reported to be less prevalent among racial/ethnic individuals than among White males and females [12].
Adding to the conundrum of adequate diagnosis and treatment of individuals with FMS symptomatology is the issue of having health insurance. The notion of FMS diagnosis being “less prevalent” in men may be due to multiple factors that include individuals being without health insurance [36, 37]. In this study, we report that for women, being uninsured was associated with a lower likelihood of FMS diagnosis. The lack of health insurance has negative consequences in that uninsured individuals are less likely to receive diagnostic services compared to those with insurance [37, 38]. Additionally, as noted by McWilliams [36] should an individual be able to receive healthcare, being uninsured places him at risk for receiving lower quality, or inadequate care. Thus, lack of insurance is seemingly associated with lower access to and quality of care, which may explain the study findings of a lower likelihood of FMS diagnosis in this dataset.
4.2.3. Limitations
Some limitations need to be considered for this research. NHIS data were not collected for institutionalized individuals, including those who are homeless, military personnel, LGBTQIA+, those in long-term care facilities, etc. In addition, NHIS is self-reported data, which is subject to recall, acceptability, and introspective bias [39]. When establishing the cohort of those with clinically diagnosed FMS, we were unable to identify those who have gout or lupus because the NHIS survey does not have a separate question for those conditions. As a result, we were not able to evaluate a potentially confounding effect. Further, the NHIS only asked for a timeframe of “at least three months” which applies to the 2010 ACR criteria [40]. The only difference between the 2010 and the 2016 criteria is the adjustment of having been troubled by the latter three variables of the SSS score (headache; pain or cramps in lower abdomen; depression) for a period of at least 6 months [15]. Because abdominal pain was not available in the NHIS dataset, only depression and headaches were used and at that they do reflect the 3-month duration of symptoms as it was not possible to ascertain if the respondents reported being troubled by headaches, pain, or cramps in the lower abdomen for a period longer than 3 months. Lastly, we were unable to determine whether respondents had ever consulted a physician about their chronic pain or received any type of clinical or pharmacological intervention.
CONCLUSION
While the reported study findings may not seem surprising, the value lays in the confirmation that perhaps there are cohorts of FMS patients who are being missed or who are perhaps not being treated, or not being treated adequately for management of their symptoms [18, 22, 36, 37]. Transparency related to the weaknesses associated with gathering and analyzing this data has been voiced. These findings highlight the historically reported low incidence rates of FMS diagnoses in men as compared to women. It is important to note that in the literature FMS diagnosis has been confirmed using either the 2010 ACR Diagnostic criteria [40] or the 2016 criteria [15]. It may be that the reported prevalence of men with diagnosed FMS will change as clinicians move away from the 2010/2016 ACR diagnostic criteria and apply instead the International Classification of Diseases 11th Revision (ICD-11) diagnostic criteria, effective as of January 1, 2022, to the differential diagnosis of patients who present with FMS-related symptomatology [41-45]. Identifying and diagnosing FMS in both genders may continue to face challenges for several reasons. Reasons may include those already noted. i.e., the lack of adult men seeking treatment for their chronic pain, the fluctuating psychophysiological nature of FMS symptomatology, health inequities related to social determinants of health, or because a biological diagnostic indicator has yet to fully emerge onto the healthcare scene [46-50].
AUTHORS' CONTRIBUTION
It is hereby acknowledged that all authors have accepted responsibility for the manuscript's content and consented to its submission. They have meticulously reviewed all results and unanimously approved the final version of the manuscript.
LIST OF ABBREVIATIONS
| ACR | = American College of Rheumatology |
| FMS | = Fibromyalgia Syndrome |
| ICD-11 | = International Classification of Diseases 11th Revision |
| LGBTQIA+ | = Pertains collectively to people who identify as lesbian, gay, bisexual, transgender, queer or questioning their gender, intersex, asexual, as well their allies. |
| NHIS | = National Health Interview Survey |
| ROC | = Receiver Operating Characteristic |
| SAS | = Statistical Analysis Software |
| SSS | = Symptom Severity Score |
| WPI | = Widespread Pain Index |
AVAILABILITY OF DATA AND MATERIALS
The data supporting the findings of the article is publicly available at: https://www.cdc.gov/nchs/nhis/nhis_2018_data_release.htm from the National Health Interview Survey sponsored by the National Center for Health Statistics.