All published articles of this journal are available on ScienceDirect.

The Value of Soluble Transferrin Receptor and Soluble Transferrin Receptor-ferritin Index in Discriminating Iron Deficiency Anaemia from Anaemia of Chronic Disease in Patients With Rheumatoid Arthritis
Abstract
Background:
Anaemia is a common extra-articular manifestation of rheumatoid arthritis (RA) where anaemia of chronic disease (ACD) and iron deficiency anaemia (IDA) are the two most frequent types. The distinction between these two types of anaemia has always been challenging requiring sophisticated techniques. Serum transferrin receptor (sTfR) a truncated soluble form of the transferrin receptor is one of the parameters that is influenced by the Iron content and supply to the erythrons and is not affected by inflammatory status and therefore the use of the sTfR/log ferritin (sTfR-F) index can be a reliable indicator of functional iron deficiency.
Aim of the study:
This study aims to evaluate the usefulness of sTfR and sTfR-F index in discriminating the most common types of anaemia in patients with RA.
Patients and methods:
The study included 50 patients with RA and 30 healthy subjects as a control group. Complete blood picture, C-reactive protein, serum Iron, unsaturated iron binding capacity, sTfR and serum ferritin were tested.
Results and Conclusion:
anaemia was present in 34/50 patients; 19 patients had ACD, 9 had ACD/IDA and only 6 patients had IDA. Both the sTfR and the sTfR-F index showed a significant difference between anaemia groups (P values = 0.037 and 0.001, respectively). sTfR-F index has shown to be a very useful parameter that can discriminate efficiently between IDA and ACD and between ACD and ACD/IDA in patients with RA.
1. INTRODUCTION
It has been estimated that about 16%-65% of Rheumatoid Arthritis (RA) patients develop anaemia during the disease course [1]. The anaemia in RA is multifactorial resulting from abnormal iron utilization, a blunted erythropoietin response attributed to cytokine activation, shortening of the RBC survival, decrease erythropoietin production and iron deficiency due to disturbed absorption or blood loss from the alimentary tract. All these factors could contribute to the development of anaemia in patients with RA [2].
The distinction between anaemia of chronic disease (ACD) and iron deficiency anaemia (IDA) for proper categorization is complicated by the fact that the two types of anaemia may coexist together [3]. The detection of IDA in patients with RA has clinical relevance because it is treatable and it can be an early marker for gastrointestinal bleeding [4].
Serum soluble transferrin receptor (sTfR) is a truncated form of the transferrin receptor present on the surface of erythroblast in the bone marrow. The concentration of sTfR in the serum is inversely correlated with the intracellular iron content [5], unlike the other parameters of iron status it is not affected by inflammatory status and therefore it can be a better parameter in assessing functional iron status [6, 7].
Some authors also reported that the use of the sTfR-F index, theoretically will take advantage of the reciprocal relationship between the two variables influenced by iron deficiency [8]. One of the drawbacks of sTfR is that it can increase in conditions associated with accelerated erythropoiesis irrespective to the iron status of the body. The use of sTfR-F index will overcome this problem and the combined use of them can detect subclinical iron deficiency before clinical overt anaemia develops. Suominen et al. found sTfR-F index to be useful in detecting iron deficiency in anaemic RA patients [9]. Other researchers have demonstrated improvement in the discriminating ability of sTfR-F index by the concomitant measurement of serum hepcidin [10].
This study aimed to evaluate the usefulness of sTfR and sTfR-F index in discriminating between the most common types of anaemia in Iraqi patients with RA.
2. METHODS
This cross-sectional study was carried out in the Teaching Laboratories of Medical City, Baghdad. The study included 50 patients (40 females and 10 males) with RA who attended the Rheumatology outpatient clinic at Baghdad Teaching Hospital, Medical City. All patients met the revised criteria of the American College of Rheumatology for the classification of RA [11]. The study also included 30 sex- and age-matched healthy subjects as a control group (23 females and 7 males).
Patients who had acute blood loss or received a blood transfusion in the past 3 months or treated with iron therapy in the past 2 weeks and patients with a history of renal and endocrine diseases were all excluded from the study.
Full blood counts were determined using automated haematology analyser (Ruby, Abbott Diagnostics, USA). Serum irons, Unsaturated Iron Binding Capacity (UIBC) were measured using direct colorimetric assay using automated analyser (ARCHITECT c4000, Abbott Diagnostics, USA). The Total Iron Binding Capacity (TIBC) was calculated as the sum of serum iron and UIBC measurements. The percent transferrin saturation (%TSAT) value is derived from serum iron × 100 /serum TIBC. Serum ferritin concentration was measured by electrochemiluminescence immunoassay (Cobas e 411, Roche Diagnostics, Germany) using a commercial kit for ferritin (Roche Diagnostics, Mannheim, Germany). Serum sTfR was measured by an ELISA method (Quantikine IVD kit, R&D incorporation, USA). The normal values range recorded by the kit leaflet was 8.7-28.1 nmol/L (0.739 -2.388 mg/L). sTfR-F index was calculated by dividing sTfR over log10 serum ferritin [8].
Anaemia was defined according to the WHO criterion as haemoglobin level less than 13 g/dl for males and haemoglobin less than 12 g/dl for females [12]. Anaemic patients were classified into 3 groups adopting the following criteria [13]:
- IDA: if ferritin was < 30, TSAT < 16% and CRP < 10.
- ACD: when serum ferritin ≥ 100, TSAT ≥ 16%, and CRP ≥ 10.
- Combined IDA/ACD: when serum ferritin < 100, TSAT < 16% and CRP ≥ than 10.
2.1. Statistical Analysis
Statistical analysis was done using SPSS version 20, numerical data were presented as mean ± Standard Deviation (SD). Student’s t-test was used to compare the means of the two groups whenever data proved to be normally distributed. The means between more than two groups for normally distributed variables were tested by ANOVA and the post-hoc Tukey test was applied to compare the two groups. Receiver Operating Characteristics (ROC) curve was done to determine the best cut-off value of sTfR-F index in discriminating various types of anaemia.
3. RESULTS
The mean age of the patients, control was 45.58 ± 10.36, 43.85 respectively. Among the patient’s group 34 out of 50 (68%) were anaemic. T-test showed the presence of significant statistical differences between the patients and control in all the test variables except for serum ferritin. Patients were stratified according to gender. In the male group, there was no statistically significant difference for Serum Ferritin, Soluble transferrin receptor and sTfR-F index. On the other hand, apart from Serum Ferritin all the other parameters were significantly different in the female group. These results are summarized in Table 1.
| – | – | Male | Female |
|---|---|---|---|
| Hb (g/dl) | patient | 12.38 ± 0.75** | 11.13 ±1.52** |
| control | 15.21± 0.77 | 12.98 ± 0.98 | |
| HCT (l/l) | patient | 38.55 ± 2.79** | 34.36 ± 4.13** |
| control | 44.48 ± 1.74 | 37.9 ± 2.71 | |
| MCV (fl) | patient | 78.65 ± 5.83** | 79.21 ± 7.97** |
| control | 85.50 ± 2.53 | 85.23 ± 3.85 | |
| MCH (pg) | patient | 25.79 ± 2.33** | 25.06 ± 3.28** |
| control | 29.58 ±1.02 | 29.36 ± 1.32 | |
| RDW (%) | patient | 13.84 ±2.68** | 13.49 ± 2.03** |
| control | 10.41 ±0.54 | 11.36 ± 1.01 | |
| CRP (mg/l) | patient | 10.66 ±3.2** | 6.99 ±4.52** |
| control | 1.18 ± 0.99 | 1.24 ± 1.18 | |
| S iron (μg/dl) | patient | 34.800 ± 16.70** | 41.500 ±18.4** |
| control | 108.14 ±30.68 | 82.82 ± 21.83 | |
| TIBC (μg/dl) | patient | 244.60 ±99.26* | 313.42 ±74.25* |
| control | 349.57 ±37.92 | 348.73 ±34.41 | |
| Transferrin saturation (%) | patient | 15.60 ± 5.95** | 14.06 ±6.24** |
| control | 30.65 ± 6.87 | 23.80 ± 6.15 | |
| Serum Ferritin (µg/l) | patient | 93.38 ± 76.07 | 87.11 ± 132.84 |
| control | 113.18 ± 83.93 | 42.64 ±26.94 | |
| sTfR (mg/l) | patient | 2.38 ±1.28 | 2.26 ±1.13* |
| control | 1.61 ±0.51 | 1.70 ±0.62 | |
| sTfR-F index | patient | 1.11 ±0.44 | 1.78 ±1.67* |
| control | 0.85 ± 0.26 | 0.99 ± 0.40 | |
| *: p<0.05, **: p<0.0` | |||
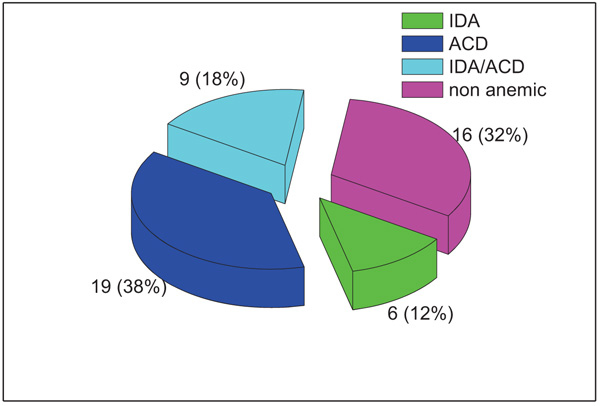
According to the classification scheme applied, 16/50 (32%) patients were non-anaemic and 34/50 (68%) patients were anaemic; 19 patients had ACD, 9 had ACD/IDA and only 6 patients had IDA as shown in Fig. (1).
For haematological parameters a significant difference was demonstrated for MCV, MCH and RDW when compared between anaemia groups. Tukey test has shown that the significant difference for MCV and RDW was between ACD group and the combined anaemia group while for MCH the difference was between both ACD and the combined anaemia group and between ACD and IDA group (Table 2).
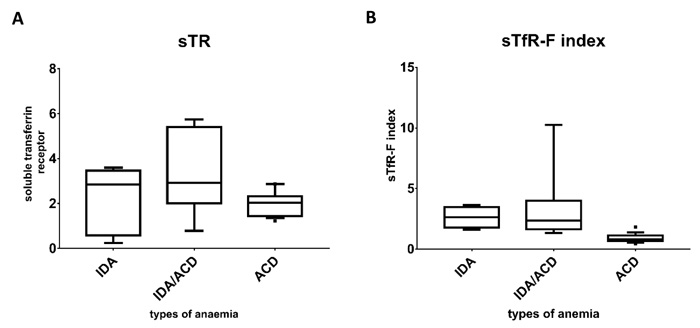
Fig. (2) illustrates the median and the interquartile range of the study groups and it shows that the lowest ferritin level was seen in the IDA group compared to the combined and the ACD groups. The level of the soluble transferrin receptor was comparable between patients with IDA and the combined group and clearly higher than that seen in ACD group. Comparing the sTfR-F index between the groups clearly shows that lowest values were seen in the ACD group and the highest were in the IDA group.
The mean sTfR in the ACD group was 2.077 ± 0.76 while the mean sTfR-F index in the same group was 0.90 ± 0.76, for the combined state the mean sTfR was 3.4 ± 1.79 and the mean sTfR-F index was 3.29 ± 2.78, and for the IDA group the mean sTfR was 2.27 ± 1.44 and the mean sTfR-F index was 2.63 ± 0.87. Both the sTfR and the sTfR-F index showed significant statistical differences between the various categories of anaemia with P values of 0.037 and 0.001, respectively. Tukey test has shown that for the sTfR the significant difference was between ACD and the combined anaemia group (P value = 0.031) but sTfR was not useful to discriminate neither between IDA and ACD groups nor between IDA and the combined anaemia groups. On the other hand, the sTFR-F index was successful to discriminate between ACD and combined anaemia (P-value = 0.001) and between ACD and IDA (P-value = 0.047). Schematic representation of median and interquartile ranges is presented in Fig. (3) to demonstrate the distribution of those parameters among the anaemia categories.
| Haematological Parameters |
ACD (19) Mean±SD |
IDA (6) Mean±SD |
ACD/IDA (9) Mean±SD |
P value |
|---|---|---|---|---|
| Haemoglobin (g/dl) | 11.155 ± 1.380 | 10.066 ± 0.697 | 10.188 ± 1.012 | 0.064 |
| HCT L/L | 34.915 ± 4.845 | 32.100 ± 2.293 | 32.333 ± 2.928 | 0.182 |
| MCV (fl) | 79.584 ± 6.738 | 72.916 ± 4.454 | 72.255 ± 6.933 | 0.013* |
| MCH (pg) | 25.673 ± 2.599 | 22.543 ± 2.133 | 22.700 ± 2.225 | 0.006* |
| MCHC | 32.133 ± 1.199 | 32.342 ± 1.065 | 31.433 ± 1.202 | 0.071 |
| RDW % | 12.910 ± 2.264 | 15.116 ± 1.146 | 15.488 ± 1.992 | 0.007* |

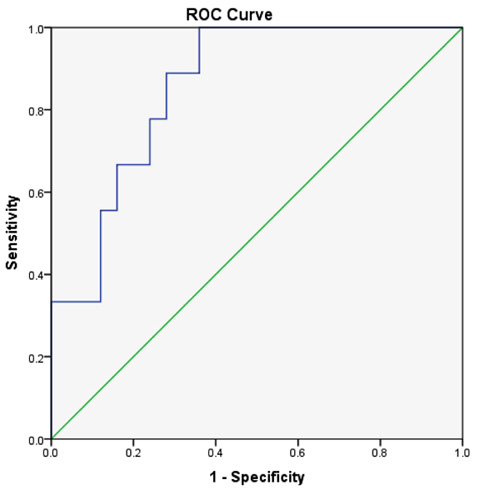
When the ROC curve was done to determine the maximum sensitivity and specificity for different cut-off values of the sTfR-F index in discriminating the functional iron deficiency state (ACD/IDA group) from ACD, the best cut-off value was 1.48 at which the sensitivity was 88% and the specificity was 72% and the area under the curve (AUC) was 0.858 (Fig. 4).
4. DISCUSSION
Anaemia is a common manifestation in patients with RA. Different types of anaemia could develop with ACD and IDA being the most common types. Distinction between these two types of anaemia has always been one of the major difficulties encountered in clinical practice especially in the chronic inflammatory disease where both types of anaemia could coexist together. The gold standard method for assessing iron status is the examination of bone marrow iron by Perl’s reaction; however, this method is invasive and inconvenient for the patients. Different tests have been designed in an attempt to provide a sensitive non-invasive method to assess body iron status.
Since its introduction, serum sTfR has proven to provide valuable information for body iron assessment in the presence of inflammatory conditions, however, Its use in clinical practice has been hampered by the lack of consensus about the source of the antibody and methods of standardization [14, 15].
In the current study, anaemia was detected in 34 patients (68%) of whom 38% were ACD, 18% IDA/ACD and 12% were found to be IDA in type.The prevalence of anaemia in RA patients was variable in different studies ranging from 30%-70% [1, 16]. This high prevalence of anaemia in our study population may be related to the high number of females (80%). The gender genetic differences might be one explanation as well as poor access to medical centres both could be contributing factors. ACD was the most common type of anaemia in this study and this finding is consistent with other studies [16, 17].
Regarding the haematological parameters, the MCV and the MCH were lower in IDA and ACD/IDA patients compared to ACD patients. The highest mean percent of RDW was found in ACD/IDA and IDA groups while the lowest value was found in the ACD group. Our results were comparable with the studies of Susanne et al. [13] and Jain et al. [3] who also reported a significant difference for the MCV and MCH between different types of anaemia in RA patients.
Our results have shown that for the sTfR the significant difference was between ACD and the combined anaemia group (P-value = 0.031) but sTfR was not useful to discriminate neither between IDA and ACD groups nor between IDA and the combined anaemia groups. The fact that the sTfR level can be affected by other factors than the iron status, namely the rate of erythropoiesis, could partially explain this finding but when the sTfR-F index was used the discriminant capacity of the sTfR was increased. Indeed, the sTfR-F index could discriminate between ACD and combined anaemia group and also between ACD and IDA group. The findings in this study agree with a previous study [9] that offered evidence that both sTfR and the sTfR-F index are useful in detecting functional iron deficiency irrespective to the concurrent iron storage status. Also, the study of Song JS et al. [18] found the sTfR to be inversely correlated with the bone marrow iron status. Margetic et al. [19]. Also reported that the sTfR-F index is particularly useful in cases where the values of both sTfR and serum ferritin are borderline and the index was more sensitive than both in the detection of iron deficiency.
The ROC curve has shown that the best sensitivity and specificity the for sTfR-F index was at a cut-off value of 1.48 which can discriminate between combined anaemia state (IDA+ACD) and ACD. Skikne et al [8] cut of value was higher than ours (1.03) which might be attributed to the different clinical settings and inclusion of other patients in addition to RA. Our results are comparable to that of Suominen et al. [9] where a cut-off value of 1.35 was used for efficiently detecting a state of iron deficiency in patients with RA.
CONCLUSION
In conclusion, the sTfR-F index is a very useful parameter that can discriminate efficiently between ACD and IDA and also between ACD and combined ACD/IDA in patients with RA and it is useful to improve the evaluation of anaemia in these patients.
DATA AVAILABILITY
The research laboratory and clinical data used to support the findings of this study are included within the article.
FUNDING STATEMENT
This research received no specific grant from any funding agency in the public, commercial, or not-for-profit sectors.
ETHICS APPROVAL AND CONSENT TO PARTICIPATE
The study was approved by the scientific committee in pathology department, college of medicine, university of Baghdad, Iraq.
HUMAN AND ANIMAL RIGHTS
No Animals were used in this research. All human research procedures followed were in accordance with the ethical standards of the committee responsible for human experimentation (institutional and national), and with the Helsinki Declaration of 1975, as revised in 2013.
CONSENT FOR PUBLICATION
Informed consent was obtained from all participants before data collection.
CONFLICT OF INTEREST
The authors declare no conflict of interest, financial or otherwise.
ACKNOWLEDGEMENTS
Declared none.